Once you achieve an understanding of price action dynamics, all you need to trade successfully is a five-minute chart and a 20-bar exponential moving average (EMA). This works for scalping trades in the E-mini S&P 500, but also stocks and options for intraday and daily swings. It’s also quite effective in 10-year Treasury notes (TY).
The strategy is to enter on a stop at one tick beyond the signal bar so that the market has to be moving in your direction for you to enter a position. It is worth paying a little extra for the confirmation that there is strength in the direction of the trade. For example, if there is a buy setup, place a buy stop order to go long at one tick above the high of the previous bar. That previous bar is the signal bar, and the bar where the entry is made is the entry bar.
This article will focus on the differences between trading E-minis and 10-year T-note futures.
When Eminis sleep
Although the E-mini is the preferred market for this strategy and it rarely pays to turn your attention toward other markets at the expense of opportunity here, there are times when the E-mini is not providing the proper setups. That said, if a particularly strong pattern emerges, you can’t ignore it, even if it pulls you away from your favorite market. Each trader will have to define “particularly strong” for themselves.
In any case, all markets are related and there are usually setups taking place in many simultaneously, but you can only scalp one at a time. If the T-notes or stocks have a high probability setup for a 30- to 60-minute swing, a perfectly good opportunity may arise for a later entry in the E-mini.
The primary differences between E-mini and TY trading are:
• The goals of the trade. TY is better traded for intraday swings.
• The size and strength of the moves. TY often has protracted intraday trends.
• Slippage. Much more common in TY.
• The value of each tick ($12.50 in the E-mini and $15.625 in TY).
• The average daily range.
• Stop sizes. Dollar stops, such as eight ticks, work better in the E-mini and price action stops, such as above a swing high when you are short, work better in TY.
• Profit targets. The E-mini is great for scalping and TY is great for intraday swing trades.
• The frequency of signals. There are far more in the E-mini on average.
Although you can effectively scalp the TY, there are usually far fewer setups than in the E-mini and, therefore, the E-mini is a better scalping vehicle. However, intraday trends are often strong and persistent in the TY, which is great for bigger moves that don’t require a scalper’s attention. Both types of trading work in both markets.
The average daily range recently has been about 60 ticks for TY and 80 for the E-mini, so there is enough movement to scalp or swing both. However, TY is far more prone to developing a condition known as Barb Wire, which should be avoided by most traders. If 50% or more of a bar is overlapped by the bars immediately before and after, this three-bar pattern is called Barb Wire.
Once it sets in, the condition can grow to 10 or more bars, but it usually ends up being about five to 10 bars long. The bars usually have smaller bodies and larger tails, and it is an area of uncertainty where neither the bulls nor the bears are in control. Because it is a small, tight trading range, breakouts above and below usually fail and a trader entering on stops will get whipsawed, which is a disaster for a scalper who needs a high winning percentage. TY is much more likely to have extended Barb Wire patterns, sometimes lasting an hour or more, and they are not worth trading. When one is forming, it is usually best to ignore the market for the rest of the day.
T-Note price action examples
Although you can scalp TY for four ticks using a four- to six-tick stop, in general it is best to let some or all contracts run. If you trade two lots, you can scalp one and after taking the four- to six-ticks profit, move the stop to breakeven, and then swing the other contract.

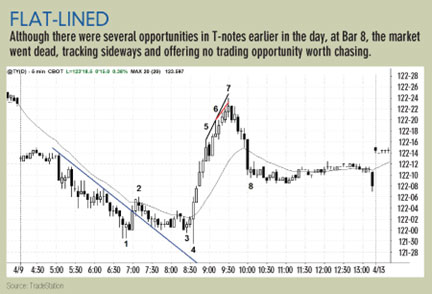
For example, if you bought the lower low in “Flat-lined” at the Bar 4 entry bar and exited at one tick below the Bar 7 wedge — all three push patterns and trend channel line overshoots trade like wedges and usually are wedges on a smaller time frame, and therefore are best thought of as wedges — you would have made four ticks on the scalp and 20 more ticks on the swing for a total of 24 ticks, or an average of $350 per contract with an initial risk of about $100 per contract.
After such a strong up move, most traders would be looking to buy again in a pullback for a test of the highs. However, a wedge top is usually followed by at least two legs down and a correction that lasts longer than most traders expect, and there was no good setup for the rest of the day. Look at Bar 8. It is small with a small body and more than half of it is overlapped by the bar before and the bar after. This is a Barb Wire pattern and a strong signal to look elsewhere for trades.
“Flat-lined” illustrates a couple other important points. First, you should not be looking to buy a bear until after there has been a move up that was strong enough to break above a bear trendline. Bar 2 broke above the bear trendline and that was an alert to look for a long entry on a higher low or lower low test of the Bar 1 bear low.
Bar 3 was a possible two-legged pullback to a higher low, but there are some problems with it, and whenever there are problems it is best to wait for another signal. First, the Bar 2 rally was weak, with only one close above the EMA. Next, the Bar 3 signal bar was small and might be part of the Barb Wire of the prior dozen bars. One of the best ways to trade Barb Wire is to not take an obvious signal and instead don’t look to enter until someone is trapped.
Bar 4 was a great trap. First, it trapped eager longs into buying the High 2 above the weak Bar 3 signal bar, and then it trapped new bears into shorting the failed buy signal. At this point, the longs were trapped out and the bears were trapped in, and that is a great setup for a long position. However, you had to be looking for traps to be ready to enter on the outside up Bar 4 that triggered the long entry. Because both sides were trapped, the market was not going to make it easy for the bears to get out or the late bulls to get in, which is usually the case with traps. Because a wedge is usually followed by a two-legged, protracted correction, it was smart to exit below Bar 7, which also took out the high of the day and is therefore a likely reversal area.

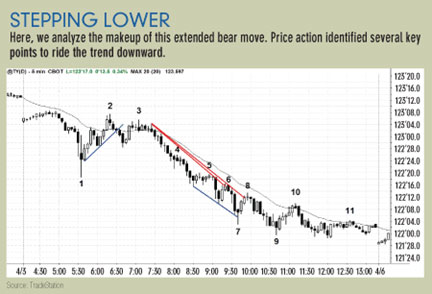
In “Stepping lower” Bar 3 formed a lower high after a break of the bull trendline and therefore was a reasonable short setup. However, this outside down bar also created Barb Wire, and it is better to wait to enter on either a stop at one tick below the low of the small outside bar or on some trap. There was a small failed High 2 that set up the short four bars later and the entry price was coincidentally the same as the short below that outside down bar. It also could be viewed as a right shoulder of a head-and-shoulders top, but don’t trade on that basis alone because most head-and-shoulders patterns fail and become with-trend setups. There was a Low 1 second entry on the breakout pullback (the Bar 4 inside bar pullback that followed the breaking below the neckline four bars earlier) and then a Low 2 at Bar 5.
Bars 5 and 6 also set up micro trendline shorts. Bar 6 is also a bull trap. Some traders would have bought the lower low, but there was no prior strong break of the bear trendline, so these early bulls were likely to end up being forced out on the first bar that fell below the low of the prior bar, which Bar 6 set up. Countertrend trades in the absence of countertrend strength (like a strong break above the bear trendline) usually become great with-trend setups when they fail. You get short where they are taking their losses on their longs. Because no one is left to buy for a while, you have a high-probability short.
Bar 8 was a micro trendline short and a possible failed wedge bottom. Although buying the Bar 7 wedge was a reasonable scalp, it is not a great swing because the momentum down was still much greater than up and the signal bar was weak. Its close was near the high of the bar but still below the open. Bar 9 was a lower low and a High 2 after the wedge and again a possible scalp for two legs up, but in the absence of a strong break of a bear trendline, short entries near the EMA are higher probability trades, such as the Bar 10 wedge (three small pushes up in five bars). Bar 10 broke the bear trendline, but the lower low fizzled out into a Barb Wire condition.

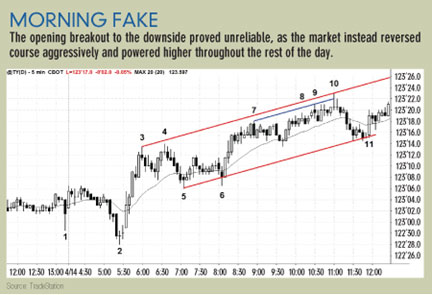
In “Morning fake” (above), Bar 2 was a sharp reversal up off the opening breakout to the downside, forming a lower low and a great long, as it reversed up from yesterday’s low. Bar 4 was as higher high Final Flag short scalp, but smart traders would look to get long on a two-legged test of the EMA. This occurred at Bar 5, but the swing portion of the long would have been stopped out at breakeven (the six-tick move up would have allowed for a four-tick scalp on the scalp portion).
Bar 6 formed a great double bottom bull flag, and a trader would have held for 18 ticks and exited just below the Bar 10 wedge. The red trendline from Bars 5 to 11 was created as a parallel of the trend channel line formed using the Bars 3 and 10 highs. You should first look to anchor the trendline at Bar 6, which would contain all of the lows, but you always need to be aware of other possible anchors. The goal is to find a pair of lines that contain the price action and then look for possible entries off reversals when the market tests these lines.
The market formed a second long set up at Bar 11 (the first being three bars earlier) on the second entry on the gap below the EMA (the top of the bar is below the EMA in a bull and this space is the gap), which is a good long setup. However, if you anchored the trendline at Bar 6, you would be nervous because Bar 11 would not have tested close enough. If you are aware that sometimes the market will have an occasional spike beyond the yet to be determined channel such as that at Bar 6 and that this is normal and common, you would be comfortable looking for alternatives, such as anchoring the line to another spike such as Bar 5.
As frustrating as it is that markets form irregularities like this, remember that all trading is in shades of gray and nothing is perfect. Close is close enough. As long as you are comfortable trading in this inescapable fog, a thorough understanding of price action will reveal a never ending parade of trading opportunities all day long.
This is based on an article from the December 01, 2007 issue of Futures magazine.