Market Overview: NASDAQ 100 E-mini Futures
The NASDAQ E-mini futures week is a bear trend bar with low at EMA – exponential moving average. This is the first touch of EMA since early April.
The daily chart has broken below the triangle from last month at the daily EMA, but at support in the weekly EMA.
The monthly bar is a big bear bar that just triggered last month’s bad sell signal bar – a doji bear bar. As prior reports have mentioned, likely targets for the bears is close of April/open of May, which is not far away (See explicit green line on daily chart).
NASDAQ 100 E-mini futures
The Weekly NASDAQ chart
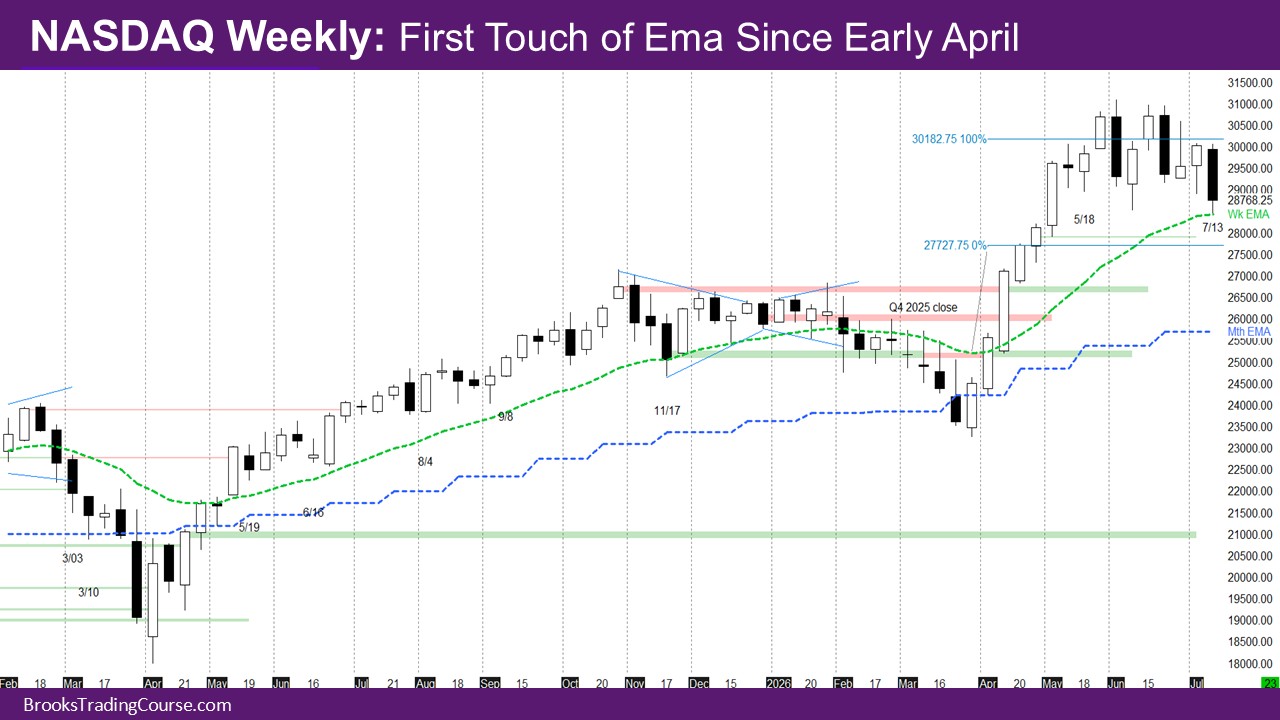
- The week is a bear trend bar with minimal tail at top, and low at the weekly EMA, and a prominent tail at the bottom to indicate a bounce.
- This is the first touch of the EMA since early April.
- Earlier reports had mentioned that the next meaningful support is at the EMA, and the open of May, which is just below the EMA.
- Last week was a buy signal bar at the 10 ema, but it did not even get triggered.
- Anyone who bought the close of last week would be trapped unless they tried to exit breakeven on Tuesday using the daily chart, when the market touched the close of last week and sold off.
- Last week’s report had mentioned the possibility of an expanding triangle – where the market would revisit the highs and then visit the EMA. Instead, the market is going to the EMA first, which may be better for the bulls, because they can try for a good buy signal and new all-time highs.
The Daily NASDAQ chart
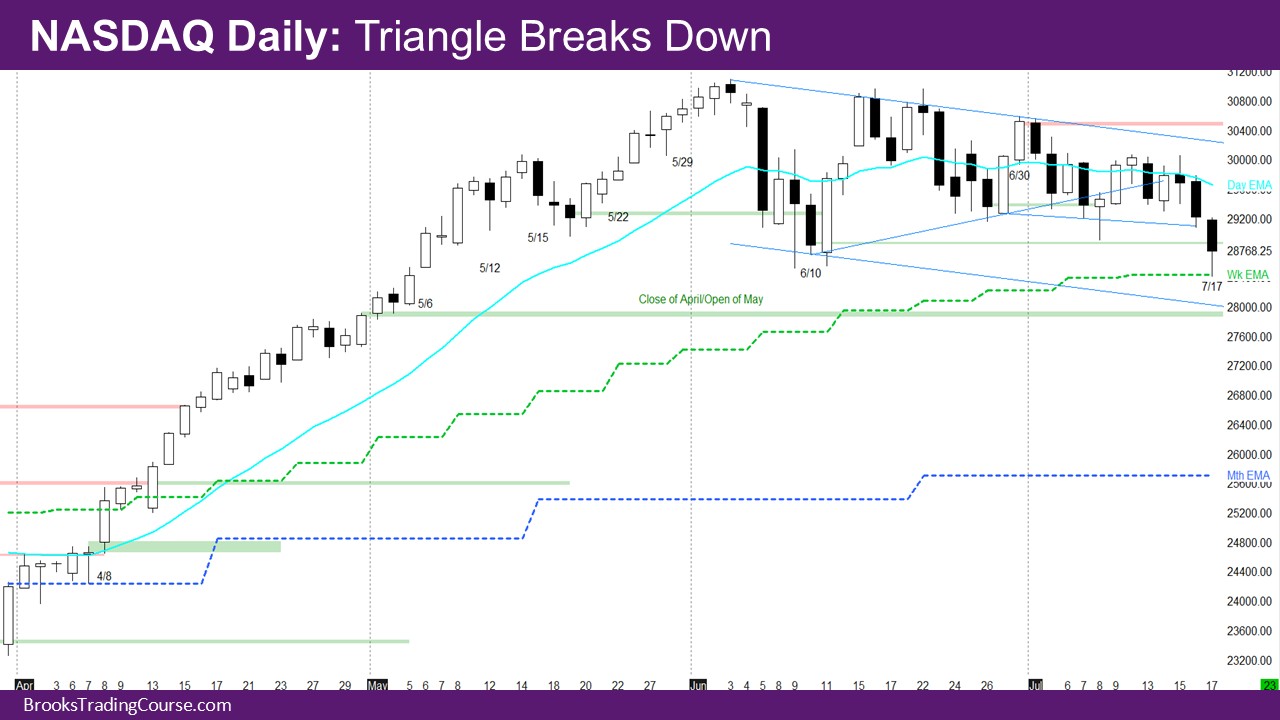
- The market has been oscillating around the EMA with the range narrowing for the past month.
- Last week, the market fell below the triangle, but reversed up.
- This led me to suggest that the market could be developing an expanding triangle – where the market is making lower lows and higher highs around the prior lows and highs, respectively.
- This would have meant that this week the market would go higher towards the prior highs – for example, the close of 6/30.
- Instead, the market continued lower. Monday is a bear bar, taking the market back below the EMA.
- Tuesday is a bull bar closing at the EMA with a prominent tail above – which is usually not a good buy.
- Wednesday is a bear doji bar with a tail above that allows bulls who bought Friday’s bull close a chance to exit breakeven.
- Between Tuesday and Wednesday, any buyers who had bought Friday’s bull close got a chance to exit with minimal loss.
- Thursday and Friday are a pair of big bear bars breaking far below the EMA.
- Friday closed below the prior low close from 6-30, and a low at the weekly EMA.
- Thursday and Friday are a pair of good bear bars, so there should be at least a small second leg.
- So what is likely is a trading range between the daily and weekly EMA for the week or so – buyers likely at the weekly EMA, and sellers at the daily EMA.
Market analysis reports archive
You can access all weekend reports on the Market Analysis page.


