Emini expanding triangle top
Updated 7:02 a.m.
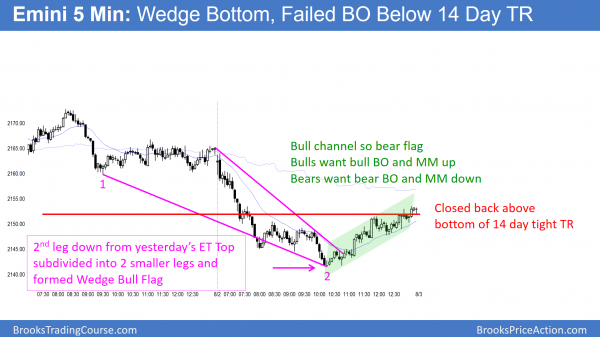
While the bears want a 2nd leg down from yesterday’s strong selloff, the initial selling today had bad follow-through. A Leg 1 = Leg 2 Measured Move down is near the bottom of the 3 week trading range. The Emini is Always In Short, yet the bears have been weak. This initial selling looks more like another leg in a trading range than the start of a successful breakout below the 3 week range. The Emini might be waiting for Friday’s unemployment report before breaking out up or down.
Because the initial selling today has been weak, the bulls are hoping that the bears give up and today forms an early low of the day. Just as the attempt bu the bears has been weak, the attempt to reverse up has been weak as well.
As a result of the inability of either the bulls or bears to create consecutive strong trend bars, and the early tight trading range, today will probably have a lot of trading range price action. This is a limit order open, and the Emini might stay mostly sideways for a couple of hours. Furthermore, this open reduces the chances of a strong swing up or down.
Pre-Open Market Analysis
August will probably be a bear trend bar on the monthly chart. This is due to 6 consecutive bull trend bars, which is unusual. When something is unusual, it is unsustainable. Hence, it is a type of climax. A climax usually is followed by a pullback.
When a bar is a bear trend bar, it usually has at least a small tail on top. This is usually as a result of a rally early in the bar’s formation. On the monthly chart, this therefore means it is usually caused by a rally early in the month. Hence, the reversal down creates the tail on the monthly chart.
Daily chart
The daily chart has been in a tight trading range for 13 days. It is therefore in breakout mode. While it is possible that today will be the start of the August selloff, the bears need to do more. They need either a more convincing top or a strong bear breakout. Without either, the odds still favor at least one more new high.
Emini Globex session
The Emini is down 4 points in the Globex session. It is still within the 14 day tight trading range on the daily chart. Hence, the odds are that today will be like every other day for the past 3 weeks. Almost every day has had many failed breakout attempts, and at least one swing up or down.
Forex: Best trading strategies
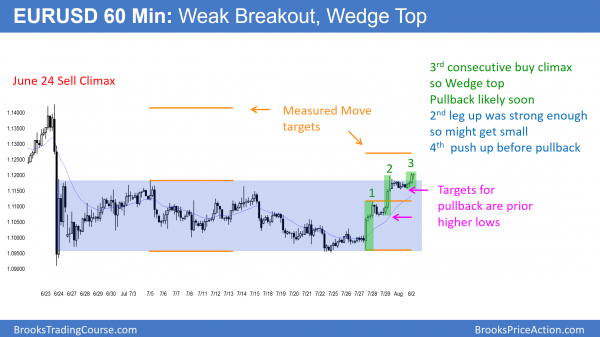
Because the rally on the 60 minute chart has formed buy climaxes and protracted pullbacks, the odds are that it is a buy climax. While it might have one more small pullback and then one more leg up, the odds are that it will pull back for a day or two this week. If the bulls can keep the pullback from getting too deep, they might be able to resume the rally to the June 24 top of the sell climax. That is also a measured move target.
After Friday’s big bull trend, yesterday was a small inside day. The bears want a reversal down from the top of the month-long trading range. The bulls do not mind a reversal down as long as it is shallow. Hence, they would see it as a bull flag. Therefore, they would buy the reversal back up, expecting a breakout above the range.
EURUSD Forex overnight sessions
After rallying beginning in the Asia session, the EURUSD has pulled back for the past 5 hours. Yesterday was a bear inside day on the daily chart. It was therefore a 1 bar bull flag. Because it was after 2 buy climaxes, the overnight rally was the 3rd push up. This is a type of wedge buy climax. Hence, it increases the chances for a pullback soon.
It will probably then enter a trading range for a couple of weeks. That trading range will probably straddle the top of the range of the past month. It would therefore also be in the middle of the range of the June 24 sell climax.
EURUSD bull breakout attempt
The EURUSD is at the top of a month-long trading range. While today is another breakout attempt on the daily chart, today’s bar is not especially big. Hence yesterday could be a 1 day Final Bull Flag. A reversal down today or tomorrow would also create a micro double top. That could be the start of a pullback. Traders would look for tests of the higher lows on the 60 minute chart.
While the overnight rally was the 3rd push up and at the top of a range, there is no sign of a reversal. Because the rally from July 27 is in a tight channel on the 60 minute chart, bulls will buy the 1st reversal down. Therefore the best the bears can reasonably hope to see over the next few days is a bear leg in a trading range.
For this bull breakout to be successful, the bulls need either one or two big bull trend bars or a series of smaller bull trend bars on the daily chart. The next target is the 1.1426 top of the June 24 sell climax. Because there have been 2 big bull bars in the past 4 days and each has had bad follow-through, this rally will probably pull back before going much higher.
Yet, the rally is strong enough so that the reversal down will probably be minor. A minor reversal leads to a bull flag or a trading range, and usually not a bear trend. Because the overnight bull breakout was smaller than the prior 2 breakouts, the rally is losing momentum. This increases the chances of a pullback within the next 2 days.
Summary of today’s S&P Emini futures price action and what to expect tomorrow
The Emini got a 2nd leg down from yesterday’s selloff from an Expanding Triangle Top. The 2nd leg subdivided into 2 smaller legs. Hence the bear channel was a Wedge Bottom. The bulls got a close back above the 2152 bottom of the 13 day tight trading range. The rally at the end of the day is a bear flag. The bears see it as a double top. They therefore want a breakout below today’s low, which is the neck line. The bulls want a breakout above the double top. Both want a Measured Move.
The Emini sold off in a 2nd leg after yesterday’s Expanding Triangle Top. It found support at the moving average on the daily chart, and reversed up to close a little above the bottom of the range. The bears see the rally as a bear flag. The bulls want a bull breakout above the bear flag. They then want a breakout above the top of the 13 day trading range. Therefore, they see this as a smaller version of the June 27 bear breakout on the daily chart. As a result, they want the same strong reversal back above the top of the trading range.
See the weekly update for a discussion of the price action on the weekly candlestick chart and for what to expect going into next week.
Traders can see the end of the day bar-by-bar price action report by signing up for free at BrooksPriceAction.com. I talk about the detailed S&P Emini futures price action real-time throughout the day in the BrooksPriceAction.com trading room. We offer a 2 day free trial.
When I mention time, it is USA Pacific Standard Time (the Emini day session opens at 6:30 am PST, and closes at 1:15 pm PST). You can read background information on the intraday market reports on the Intraday Market Update page.

