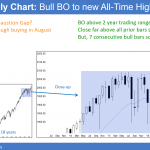
Monthly S&P500 Emini futures candlestick chart:Follow-through buying after last month’s breakout The monthly S&P500 Emini futures candlestick chart had 6 consecutive bull trend bars coming into this month. Last month was a strong bull breakout. The bulls want a bull trend bar this month to confirm last month’s breakout. Yet, 6 consecutive bull bars on […]
August buy climax and correction
Unemployment report stock market breakout
Intraday market update: August 5, 2016
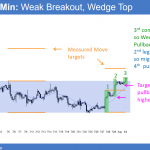
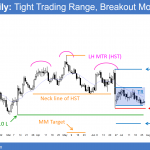
Unemployment report stock market breakout Updated 6:56 a.m. The Emini gapped up and formed a Buy The Close rally to a new all-time high. The bears want a failed breakout above the 3 week trading range. However, the bulls want a Pain Trade rally and a strong bull trend day, like a Spike and Channel […]
Trading the unemployment report breakout
Intraday market update: August 4, 2016
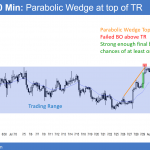
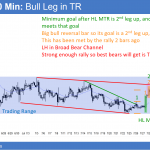
Trading the unemployment report breakout Updated 6:54 a.m. The bulls broke above yesterday’s high on the open and therefore triggered the buy signal on the daily chart. Yet, the first few bars were not strongly bullish. Furthermore, the rally has lasted about 120 bars without much of a pullback. Especially relevant is that the bears […]
Learn to trade trading range breakouts
Intraday market update: August 3, 2016
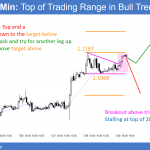
Learn to trade trading range breakouts Updated 7:05 a.m. Today opened with a bear breakout below yesterday’s bull channel. Yet, the Emini reversed up from an Opening Reversal. The follow-through stalled at the top of yesterday’s rally. It then turned down in an attempt at an Opening Reversal down. When there are both credible top […]
Emini expanding triangle top
Intraday market update: August 2, 2016
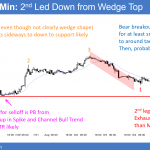
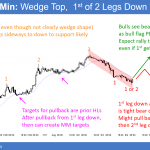
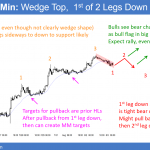
Emini expanding triangle top Updated 7:02 a.m. While the bears want a 2nd leg down from yesterday’s strong selloff, the initial selling today had bad follow-through. A Leg 1 = Leg 2 Measured Move down is near the bottom of the 3 week trading range. The Emini is Always In Short, yet the bears have […]
August stock market correction
Intraday market update: August 1, 2016
August stock market correction Update around 7:11 a.m. The Emini sold off to the 60 minute moving average and the bottom of Friday’s parabolic bull channel. Yet, the follow-through was bad. Limit order bulls and bears made money in the first 6 bars. This increases the chances of the trading range price action of the […]
August stock market crash unlikely
Emini weekend update: July 30, 2016
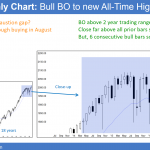
Monthly S&P500 Emini futures candlestick chart: Strong breakout to a new all-time high The monthly S&P500 Emini futures candlestick chart had a big bull trend bar closing on its high. The gap is the space between the close of this month and the high of last month. This is a strong bull breakout. However, it […]
Day trading the last day of the month
Intraday market update: July 29, 2016
Day trading the last day of the month Updated around 6:57 a.m. The Emini opened at the 60 minute moving average, which is the middle of the 12 day tight trading range. The 1st bar was a big bull trend bar, but the follow-through was bad. This reduces the chances of an hour or two […]
Day trading an August stock market bear trend
Intraday market update: July 28, 2016
Day trading an August stock market bear trend Updated 6:55 a.m. The Emini had consecutive outside days within a tight trading range. Hence, there is resistance to breaking out above or below the prior day. An outside day, especially within a tight trading range, increases the chances of an inside day. Consecutive outside days increase […]
How to trade July FOMC Report
Intraday market update: July 27, 2016
How to trade July FOMC report Updated 6:55 a.m. The Emini reversed down from above yesterday’s high and from 2 ticks below last’s week’s all-time high. However, the selloff had bull bars after bear bars. This is more typical of a weak bear trend, a trading range, or an Opening Reversal. Since the Emini is […]

