Posted 6:50 a.m. The Emini had a big gap down, but reversed up again from the December high. Although the first several bars had bull bodies, they had prominent tails on top, which is a sign of a lack of conviction. When the market opens with a big gap and the reversal is not strong, […]
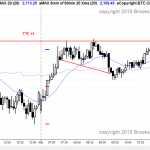
Intraday market update, March 6, 2015:
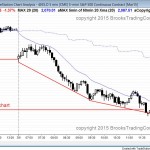
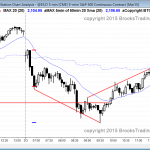
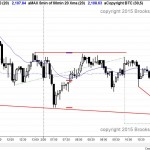
Emini weekend update: March 7, 2015:
Head and shoulders top
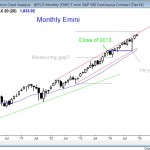
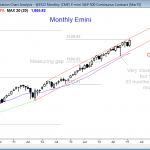
Monthly S&P500 Emini candle chart: Bear ioi sell setup in buy climax The monthly Emini candle chart has a bear inside bar this month following last month’s outside up bar. If the month stays this way, this month’s candle would be a sell signal bar. The monthly S&P500 Emini candle chart has not touched the […]
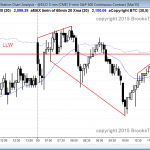
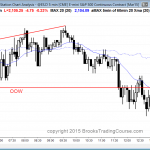
Intraday market update, March 5, 2015:
Trend reversal or a bull flag
Posted 7:05 a.m. Today opened with 3 consecutive bear bars, like the past 2 days, but it held above the moving average and reversed up in a bull opening reversal. The bulls want a leg 1 = leg 2 measured move up from yesterday’s rally. The bears want a failure at yesterday’s high. As I […]
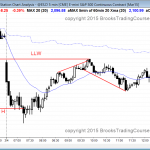
Intraday market update, March 4, 2015:
Pullback can become a trend reversal
Posted 6:58 a.m. The Emini sold off strongly on the open and fell 2 ticks below the December high. Because this was a sell climax to support, there probably will be some profit taking and there is a chance of an endless pullback up that creates the low of the day. Until the bulls create […]
Intraday market update, March 3, 2015:
Wedge top should have an ABC pullback
Posted 6:57 a.m. The Emini had a bear opening reversal and it is always in short. Since last week was a sell signal bar and the the Emini is close to the low of last week, the weekly sell signal probably will trigger today. Although, the market might reverse up and not trigger the sell, […]
Intraday market update, March 2, 2015:
More pullback from a wedge top
Posted 6:59 a.m. The Emini broke above the small trading range at the end of yesterday and tested the bottom of the upper trading range. Although it formed 7 consecutive bull bars, there were no consecutive big bull bars closing on their highs. This increases the chances that this is a bull leg in a […]
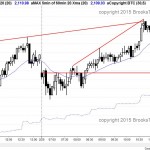
Emini weekend update: February 28, 2015:
Buy climax and wedge top
Monthly S&P500 Emini candle chart: Extreme buy climax, but no sign of a top The monthly Emini candle chart had an outside up month, but it has not touched the moving average in 33 months. This is extreme behavior and will probably lead to a 20% correction this year. The monthly S&P500 Emini candle chart […]
Intraday market update, February 27, 2015:
Double top bear flag
Posted 7:04 a.m. The Emini sold off on the open to test the open of the week. The week is currently a small doji candle, and it will probably stay that way. This means that today will probably not be a big trend day up or down. Instead, it will probably be a trading range […]
Intraday market update, February 26, 2015:
Wedge top so an ABC pullback
Posted 6:50 a.m. Yesterday ended with a sell climax and a brief strong rally. The bulls are hoping for a major trend reversal up. However, because the 60 minute wedge top is clear and in an overbought 60 minute and daily chart, any rally on the 5 minute chart will probably form a major trend […]
Intraday market update, February 25, 2015:
Buy climax on the daily candle chart
Posted 7:08 a.m. The Emini triggered a nested 60 minute wedge short on the open, but the selloff had small bars with tails. This was more likely a bear leg in a trading range than in a bear trend. Today will probably have an early trading range, like almost every day for 3 weeks has […]

