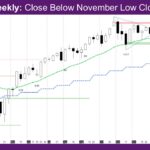
Market Overview: NASDAQ 100 E-mini Futures The NASDAQ E-mini futures week is another doji bear bar that finally has a close below November low close. The daily chart continues to be sideways between the daily/weekly exponential moving average (EMA) and the November low close. NASDAQ 100 Emini futures The Weekly NASDAQ chart The Daily NASDAQ […]
Nasdaq 100 Consecutive Dojis
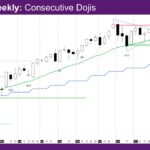
Market Overview: NASDAQ 100 E-mini Futures The NASDAQ E-mini futures week is another doji bear bar – consecutive dojis. The daily chart is sideways between the daily/weekly exponential moving average (EMA) and the November low close. NASDAQ 100 Emini futures The Weekly NASDAQ chart The Daily NASDAQ chart Market analysis reports archive You can access […]
Nasdaq 100 January Doji Sell Signal Triggered
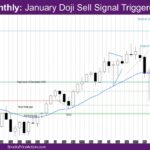
Market Overview: NASDAQ 100 E-mini Futures The NASDAQ E-mini futures February 2025 month is a bear bar with prominent tails. The January doji sell signal triggered when this month fell below the January low. The week is a doji bear bar below the weekly exponential moving average (EMA), continuing the sideways move, rather than a […]
Nasdaq 100 Buy Signal Just Below Ema
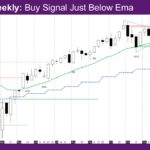
Market Overview: NASDAQ 100 E-mini Futures The NASDAQ E-mini futures week is a buy signal just below EMA – exponential moving average. The buy signal is a good bull bar, and would otherwise be a good buy signal bar, but it is just below the weekly EMA. The daily chart is sideways, likely in a […]
Nasdaq 100 Bear Inside Bar Following Biggest Bar Since April 2025
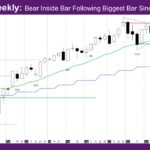
Market Overview: NASDAQ 100 E-mini Futures The NASDAQ E-mini futures week is a bear inside bar following biggest bar since April 2025. It is also the first bar since April 2025 with body completely below the weekly exponential moving average (EMA) The daily chart had a second leg down from around the weekly/daily EMA. NASDAQ […]
Nasdaq 100 Biggest Bar Since April 2025
Market Overview: NASDAQ 100 E-mini Futures The NASDAQ E-mini futures week is the biggest bar since April 2025 with a bear body and big tails around the weekly EMA – exponential moving average. The range of this week’s bar indicates that volatility is increasing. Last week’s report said that we may be building an expanding […]
Nasdaq 100 Bull Doji After December Inside Bar
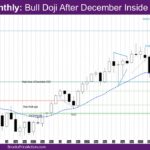
Market Overview: NASDAQ 100 E-mini Futures The NASDAQ E-mini futures January 2026 monthly bar is a bull doji after December inside bar. The week is a doji bull bar with a long tail above, reversing at the high close of October end. It indicates a bad entry bar to last week’s buy signal bar. NASDAQ […]
Nasdaq 100 Buy Signal at Weekly Ema
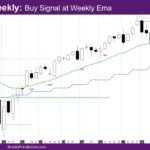
Market Overview: NASDAQ 100 E-mini Futures The NASDAQ E-mini futures week is a buy signal at weekly EMA – exponential moving average. The weekly and daily chart is at the apex of a triangle in a continued sideways breakout mode pattern. The weekly chart finally has a reasonable buy signal at the weekly EMA. The […]
Nasdaq 100 Bear Bar Reversing 1-05 Bull Bar
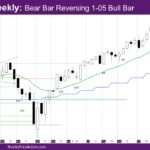
Market Overview: NASDAQ 100 E-mini Futures The NASDAQ E-mini futures week is a bear bar reversing 1-05 bull bar. The weekly and daily chart is at the apex of a triangle in a continued sideways breakout mode pattern. The monthly chart is a doji bull inside bar, which again reinforces the breakout mode pattern. NASDAQ […]
Nasdaq 100 Bull Bar Reversing 12-29 Bear Bar
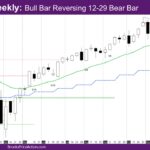
Market Overview: NASDAQ 100 E-mini Futures The NASDAQ E-mini futures week is a bull bar reversing 12-29 bear bar. The weekly and daily chart is at the apex of a triangle, with a bull bar on the daily chart at the daily exponential moving average (EMA). NASDAQ 100 Emini futures The Weekly NASDAQ chart The […]

