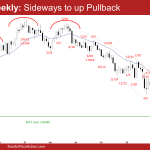
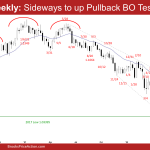
The EURUSD Forex is still in a sideways to up pullback on the weekly chart. The bulls have not yet been able to create strong consecutive bull bars since breaking below the 2017 low. If the pullback remains sideways, odds are the bears will return for a re-test of the July low.
Emini pullback before test of June 2 high
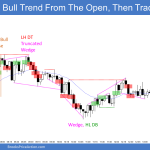
Trading Update: Friday August 5, 2022 Emini pre-open market analysis Emini daily chart The market is beginning to stall just under the June 2nd high and may have to pullback before test of the high. While the rally up to the June 2nd high has been strong, it is beginning to form a parabolic wedge, […]
Emini likely sideways at June high
Trading Update: Thursday August 4, 2022 Emini pre-open market analysis Emini daily chart Yesterday got within 8 points of the June high. It will probably have to reach it today or tomorrow. Once the market reaches the June 2nd high, Emini likely sideways around that price level. The bulls got the minimum for a second […]
Emini bulls taking partial profits
Trading Update: Wednesday August 3, 2022 Emini pre-open market analysis Emini daily chart The sideways trading over the past two days is likely due to bulls taking partial profits than bears establishing short positions. The first reversal down from the July 29th bull breakout will likely fail and lead to a second leg up and […]
Emini first reversal down likely to fail
Trading Update: Tuesday August 2, 2022 Emini pre-open market analysis Emini daily chart The Emini has had a 5-bar bull micro channel with four consecutive bull bars. The odds are beginning to favor at least a minor pullback soon, with Emini first reversal down likely to fail. The odds also favor a test of the […]
Emini second leg up likely after strong upside breakout
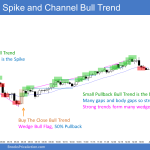
Trading Update: Monday August 1, 2022 Emini pre-open market analysis Emini daily chart The bulls have three strong consecutive bull trend bars on the daily chart with a second leg up likely. The first target for the bulls has been met: the June 9th high, which was the start of the breakout below the June […]
EURUSD breaks below 7-year trading range
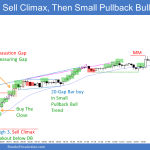
The EURUSD Forex July candlestick was a big bear bar with a long tail below. It broke below the 7-year trading range low. The long tail below indicates that the bears are not as strong as they could have been. The bears will need to create a consecutive bear bar to confirm the breakout below the 7-year trading range. The selling has been climactic. The trend channel line overshoot and wedge bottom (November 24, May 13 and July 14) increase the odds of at least a small sideways to up pullback (for a couple of weeks) before the EURUSD continue lower. The pullback may have begun in July.
Emini bulls trying to change character of market
Trading Update: Friday July 29, 2022 Emini pre-open market analysis Emini daily chart The bulls got follow-through after the July 27 breakout. This increases the odds that the market will reach the June 2 high soon, which is the last major lower high. The bulls are trying to change the character of market and want […]
Emini bulls need follow-through test of June 2 lower high
Trading Update: Thursday July 28, 2022 Emini pre-open market analysis Emini daily chart The bulls got a bull breakout closing above the July 22 high yesterday. Bulls want this breakout to have a follow-through test today reaching the June 2nd major lower high. There is a measured move projection from the July 14 low to […]
Emini likely to test July 21 close soon
Trading Update: Wednesday July 27, 2022 Emini pre-open market analysis Emini daily chart Bears ended the 8-bar bull micro channel yesterday and got a bear bar closing near its low and below the open of June 28. July 21 was a reasonable Buy The Close bar, so the market with Emini likely to test July […]

