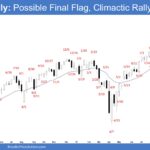
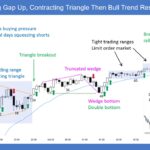
Market Overview: S&P 500 E-mini Futures The market is forming a 7-bar E-mini bull microchannel breaking above the 6900 level. The next targets for the bulls are the 7,000 and 7,100 levels. If there is a pullback, the bulls expect at least a small second leg sideways to up to retest the trend extreme high […]
E-mini Approaching October 10th High
Trading Update: Friday October 31, 2025 E-mini end of day video review You can also watch Joseph’s EOD Review for today on his YouTube channel. S&P E-mini market analysis E-mini daily chart E-mini 5-minute chart and what to expect today Yesterday’s E-mini setups Richard created the SP500 E-mini chart – Al travelling. Here are reasonable […]
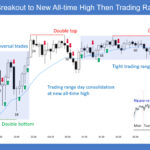
Emini Bulls Beginning to Take Partial Profits
Trading Update: Thursday October 30, 2025 S&P E-mini market analysis E-mini daily chart E-mini 5-minute chart and what to expect today Yesterday’s E-mini setups Richard created the SP500 E-mini chart – Al travelling. Here are reasonable stop entry setups from yesterday. I show each buy entry bar with a green arrow and each sell entry […]
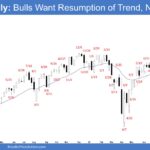
E-mini Possible Reversal Down after FOMC Announcement
Trading Update: Wednesday October 29, 2025 S&P E-mini market analysis E-mini daily chart E-mini 5-minute chart and what to expect today Yesterday’s E-mini setups Richard created the SP500 E-mini chart – Al travelling. Here are reasonable stop entry setups from yesterday. I show each buy entry bar with a green arrow and each sell entry […]
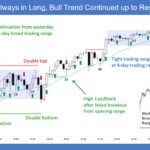
E-Mini Likely to Test Back to October High
Trading Update: Tuesday October 28, 2025 E-mini end of day video review Follow Joseph’s YouTube channel for more Al Brooks price action analysis. S&P E-mini market analysis E-mini daily chart E-mini 5-minute chart and what to expect today Yesterday’s E-mini setups Richard created the SP500 E-mini chart – Al travelling. Here are reasonable stop entry […]
E-Mini Testing 6,900 Going into Final Days of Month
Trading Update: Monday October 27, 2025 S&P E-mini market analysis E-mini daily chart E-mini 5-minute chart and what to expect today Friday’s E-mini setups Richard created the SP500 E-mini chart – Al travelling. Here are reasonable stop entry setups from Friday. I show each buy entry bar with a green arrow and each sell entry […]
E-mini Bulls Need Follow-through Buying
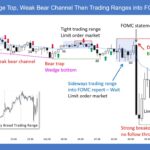
Market Overview: S&P 500 E-mini Futures The S&P 500 E-mini bulls need follow-through buying to increase the odds of reaching the measured move target above. The bears want a reversal from a wedge top pattern (May 19, Jul 31, and Oct 24). They need to create consecutive bear bars closing near their lows to show […]
E-mini Breaking Above October 10th Major Bear Breakout
Trading Update: Friday October 24, 2025 S&P E-mini market analysis E-mini daily chart E-mini 5-minute chart and what to expect today Yesterday’s E-mini setups Richard created the SP500 E-mini chart – Al travelling. Here are reasonable stop entry setups from yesterday. I show each buy entry bar with a green arrow and each sell entry […]
E-mini Upside Limited on Daily Chart
Trading Update: Thursday October 23, 2025 S&P E-mini market analysis E-mini daily chart E-mini 5-minute chart and what to expect today Yesterday’s E-mini setups Richard created the SP500 E-mini chart – Al travelling. Here are reasonable stop entry setups from yesterday. I show each buy entry bar with a green arrow and each sell entry […]
E-mini Bears Trying to Form Low 2
Trading Update: Wednesday October 22, 2025 S&P E-mini market analysis E-mini daily chart E-mini 5-minute chart and what to expect today Yesterday’s E-mini setups Richard created the SP500 E-mini chart – Al travelling. Here are reasonable stop entry setups from yesterday. I show each buy entry bar with a green arrow and each sell entry […]

