Market Overview: Bitcoin Futures
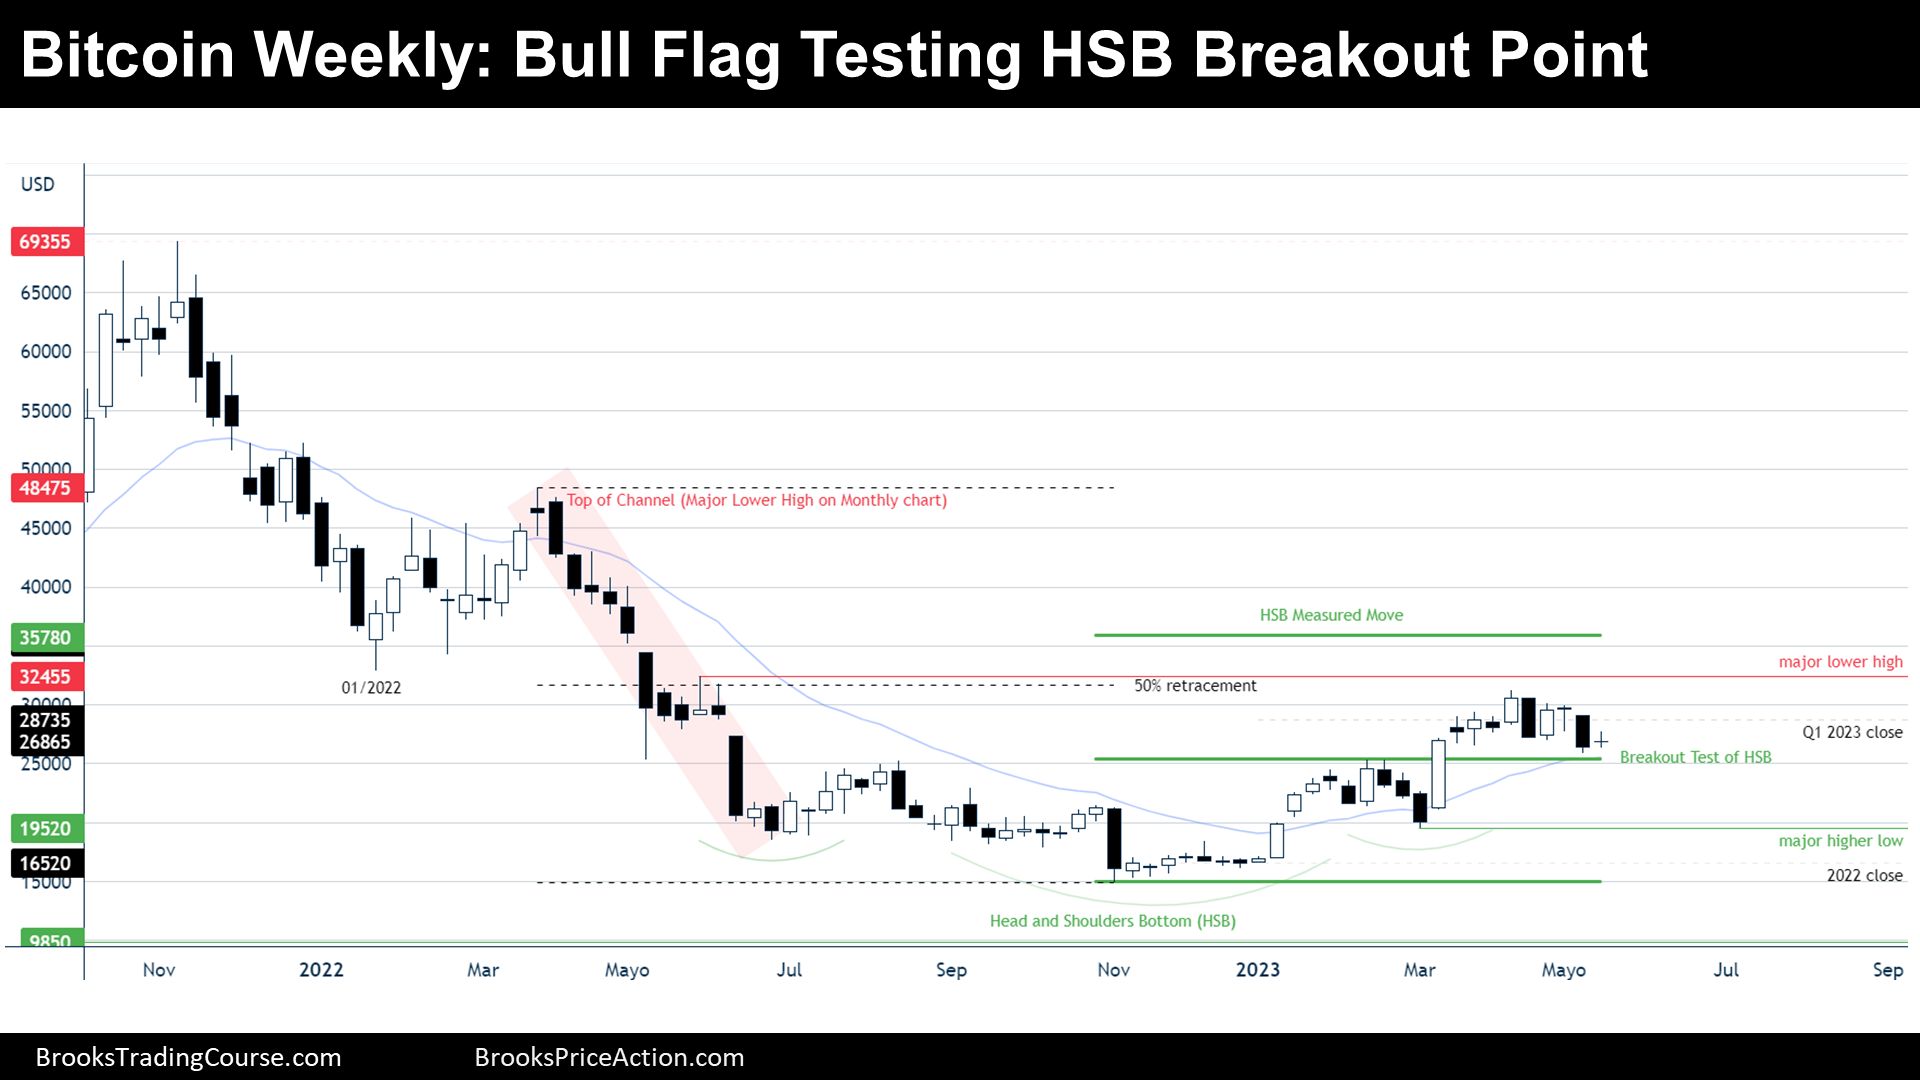
Bitcoin futures doji bar and breakout point test of a Head and Shoulders Bottom (HSB). The price increased its value by 1.57% during the week. Bitcoin gapped up on Monday and ended the week trading at around its opening price, creating a weekly doji bar. Traders wonder if bulls will resume their trend towards the HSB Measured Move (MM), or if this is a bear leg evolving within a trading range.
Bitcoin futures
The Weekly chart of Bitcoin futures

Analysis
- This week’s candlestick is an inside doji with a close below its midpoint.
- During the past 9 bars, the price has been moving sideways. However, this is also a 6-week bear micro channel.
- Within the prior report, we have said that the price is at breakout point test of a Head and Shoulders Bottom (HSB).
- Moreover, the price is also testing the 20 Exponential Moving Average (20 EMA) and the 200 Simple Moving Average (200 SMA).
- All near-term gaps (1-5 bars) are closed, and hence, the probability for the next move to be upwards or downwards is around 50%.
- Overall, there is a gap open between the HSB breakout point and the price, thus, this open gap favors the bulls.
- If bears close the gap, it means that there will likely be sellers above the actual higher high, and that will limit further upside potential. Furthermore, in that case the bull channel will probably be a Broad Bull Channel, and a broad channel is, ultimately, a leg in a trading range.
- If the gap keeps open, traders will expect the price to reach the HSB Measured Move (MM).
- If the price closes the gap, traders will expect, as much, just another leg up. More likely, this will be the start of a bear leg testing the major higher low.
- The different participant’s perspective could be something like this:
- Bulls:
- They want a bull breakout of the bull flag, but traders should not expect breakouts if all near-term gaps are closed.
- Their best case is a small pullback bull trend and maintain open the gap of the HSB breakout point, and reach the 01/2022 low, and then the HSB MM.
- On the downside, the risk is limited, since the price is coming from breaking up a pattern and hence, it created a fair major higher low that should hold the price around.
- Bears:
- They think that a bear leg in a trading range is evolving, and because trading ranges tend to close gaps, they want to close the gap between the price and the major higher low.
- If they do not close the HSB Breakout Point gap, their upside risk is high.
- Bulls:
- Since the price sits within a tight range and created a 6-week bear micro channel, bulls will probably trade above a prior high during the following 1-3 weeks.
Trading
- Bulls:
- An inside doji closing below its midpoint following a 6-week bear micro channel, it is not a good buy signal bar.
- The first High 1 after a pullback is normally sold.
- As stated during the prior report, some bulls might find interesting to buy with limits orders at the HSB breakout point, or at the 20 EMA or 200 SMA. The probability is not high, but 40% to 50% might be enough considering that between the entry, the stop loss (major higher low) and the target (HSB MM) there is a good risk reward situation.
- Most traders should wait for a breakout of the bull flag and enter with a stop order above a good bull bar because the probability of success will increase.
- Bears:
- An inside doji closing below its midpoint following a 6-week bear micro channel, might be a good stop order signal bar if there is a good context. Price trading sideways above supports, it is not good context. However, some bears will sell with a limit order above a High 1, looking for a scalp.
- Most traders should wait until there is a clear bear breakout of the supports and one or some gaps open between prior bars.
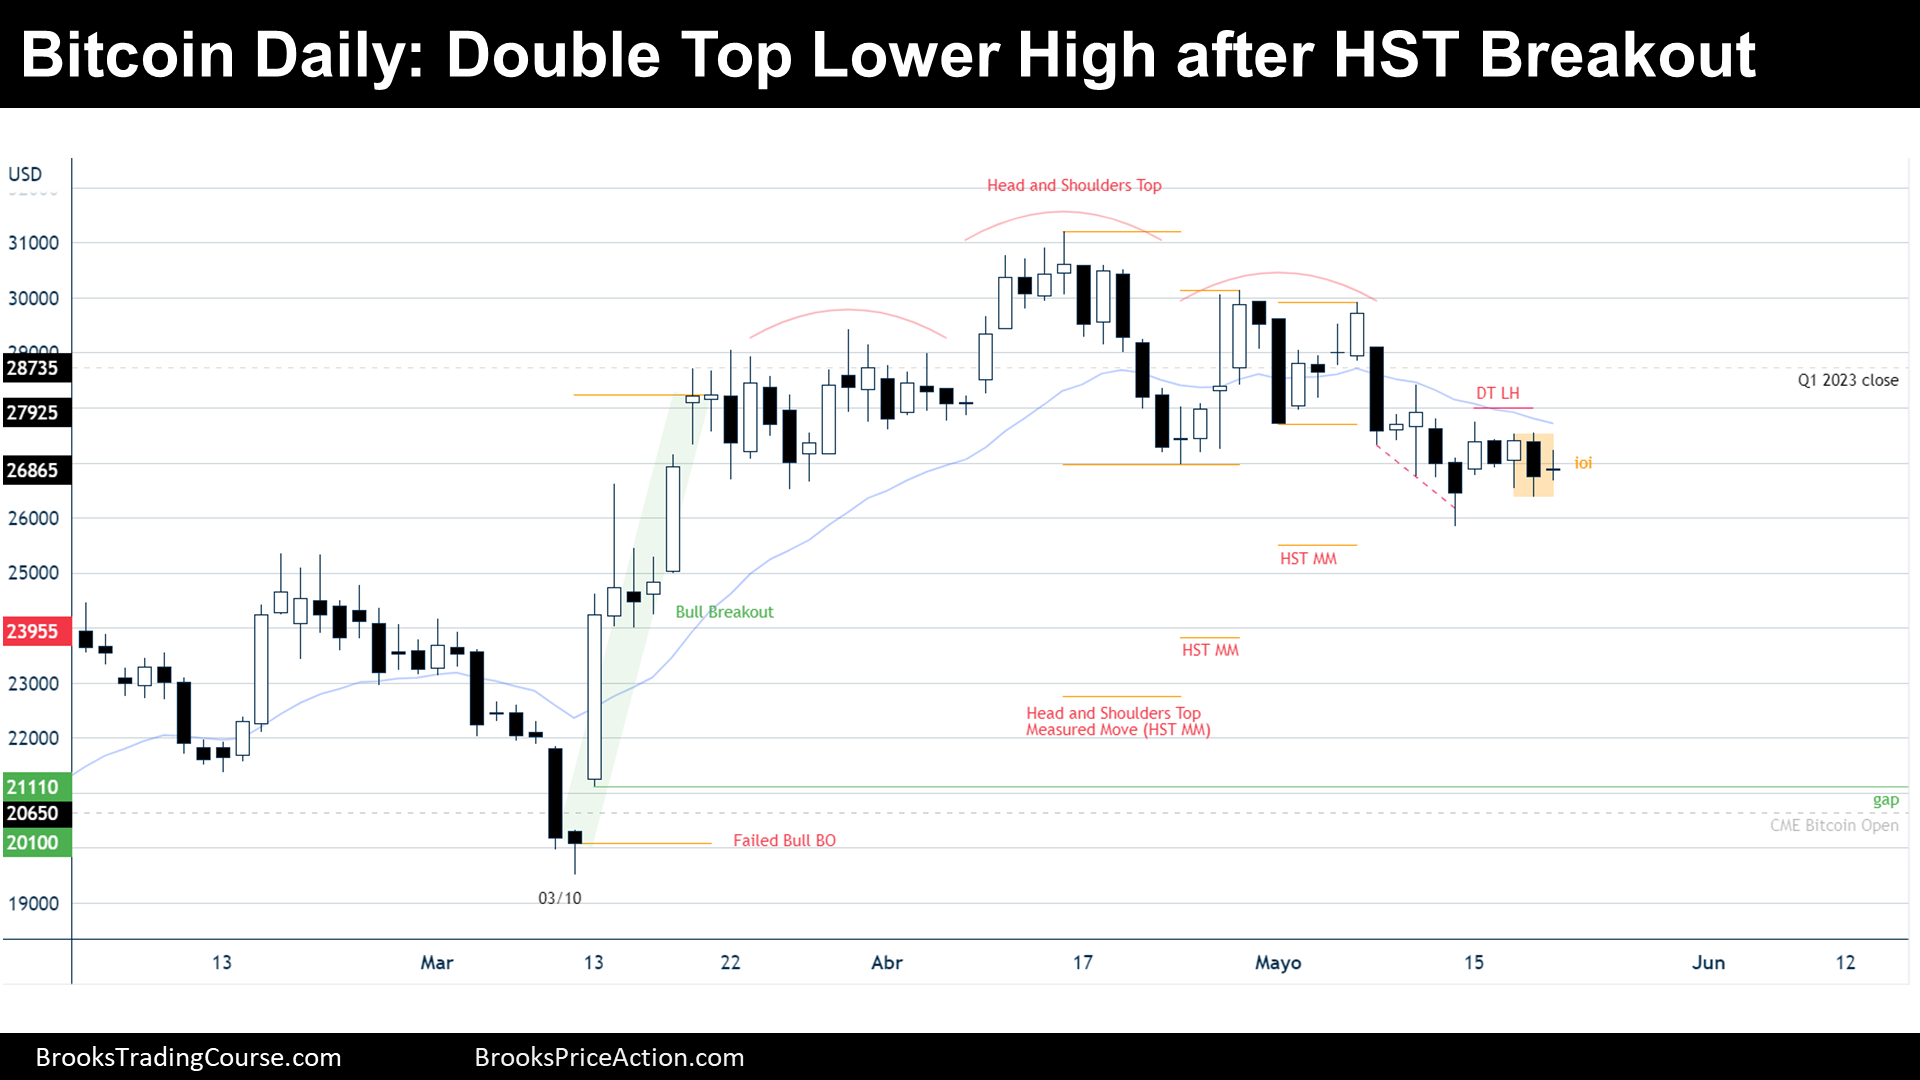
The Daily chart of Bitcoin futures

Analysis
- During the week, the price traded sideways. A bull bar on Monday was followed by a bear bar on Tuesday, which was followed by a good bull reversal bar on Wednesday, but then there was a bear bar on Thursday. Finally, the week ended with a doji.
- Definitely, this is the typical behavior during a trading range market cycle.
- During the past reports, we have discussed the breakout of the Head and Shoulders Top (HST) and looked at their possible Measured Moves. But the more time the price is trading sideways, fewer traders care about prior patterns, like the HST.
- Traders wonder where is the low of the Trading Range. The consensus is probably that the trading range high is around the HST high. But the low it is more uncertain, since the price recently traded below the HST low, and the price is still around there.
- During the bull breakout that began in March, the price paused creating three dojis, two of them formed an ii pattern. That was a pause of the bull breakout and thus, the low of the current trading range might be around there.
- There is overlap between all the past 20 bars.
- Bears look stronger because the price is at the low of the trading range, but there was not yet a strong bear breakout and hence, bears might be weaker than they look.
- Bulls want a bull leg starting soon and test the right shoulder of the HST.
- Bears want a bear breakout to confirm their strenght.
- The bull case is more likely, even if bears achieve to lower prices (with overlapping bars).
Trading
- Bulls:
- They are looking to buy a reversal up and take quick profits at around the middle of the trading range.
- Some might buy for a quick scalp with a limit order below the Double Top Lower High (DT LH) and ioi (inside-outside-inside) setup, since good stop order bear entries are good entries for bulls if the context is bad for bears. Here, we are at the buy zone of a trading range and thus, bad context for bears.
- Most traders should wait to buy above a bull bar after a reversal from a double bottom.
- Bears:
- There is a Double Top Lower High (DT LH) and an ioi setup.
- But the context is not good since the price might be low in a trading range, and hence, good bear setups are good bull setups during trading ranges.
- Most traders should wait for either a bear breakout or a reversal pattern happening around the top third of the trading range.
Market analysis reports archive
You can access all weekend reports on the Market Analysis page.