Market Overview: Bitcoin Futures
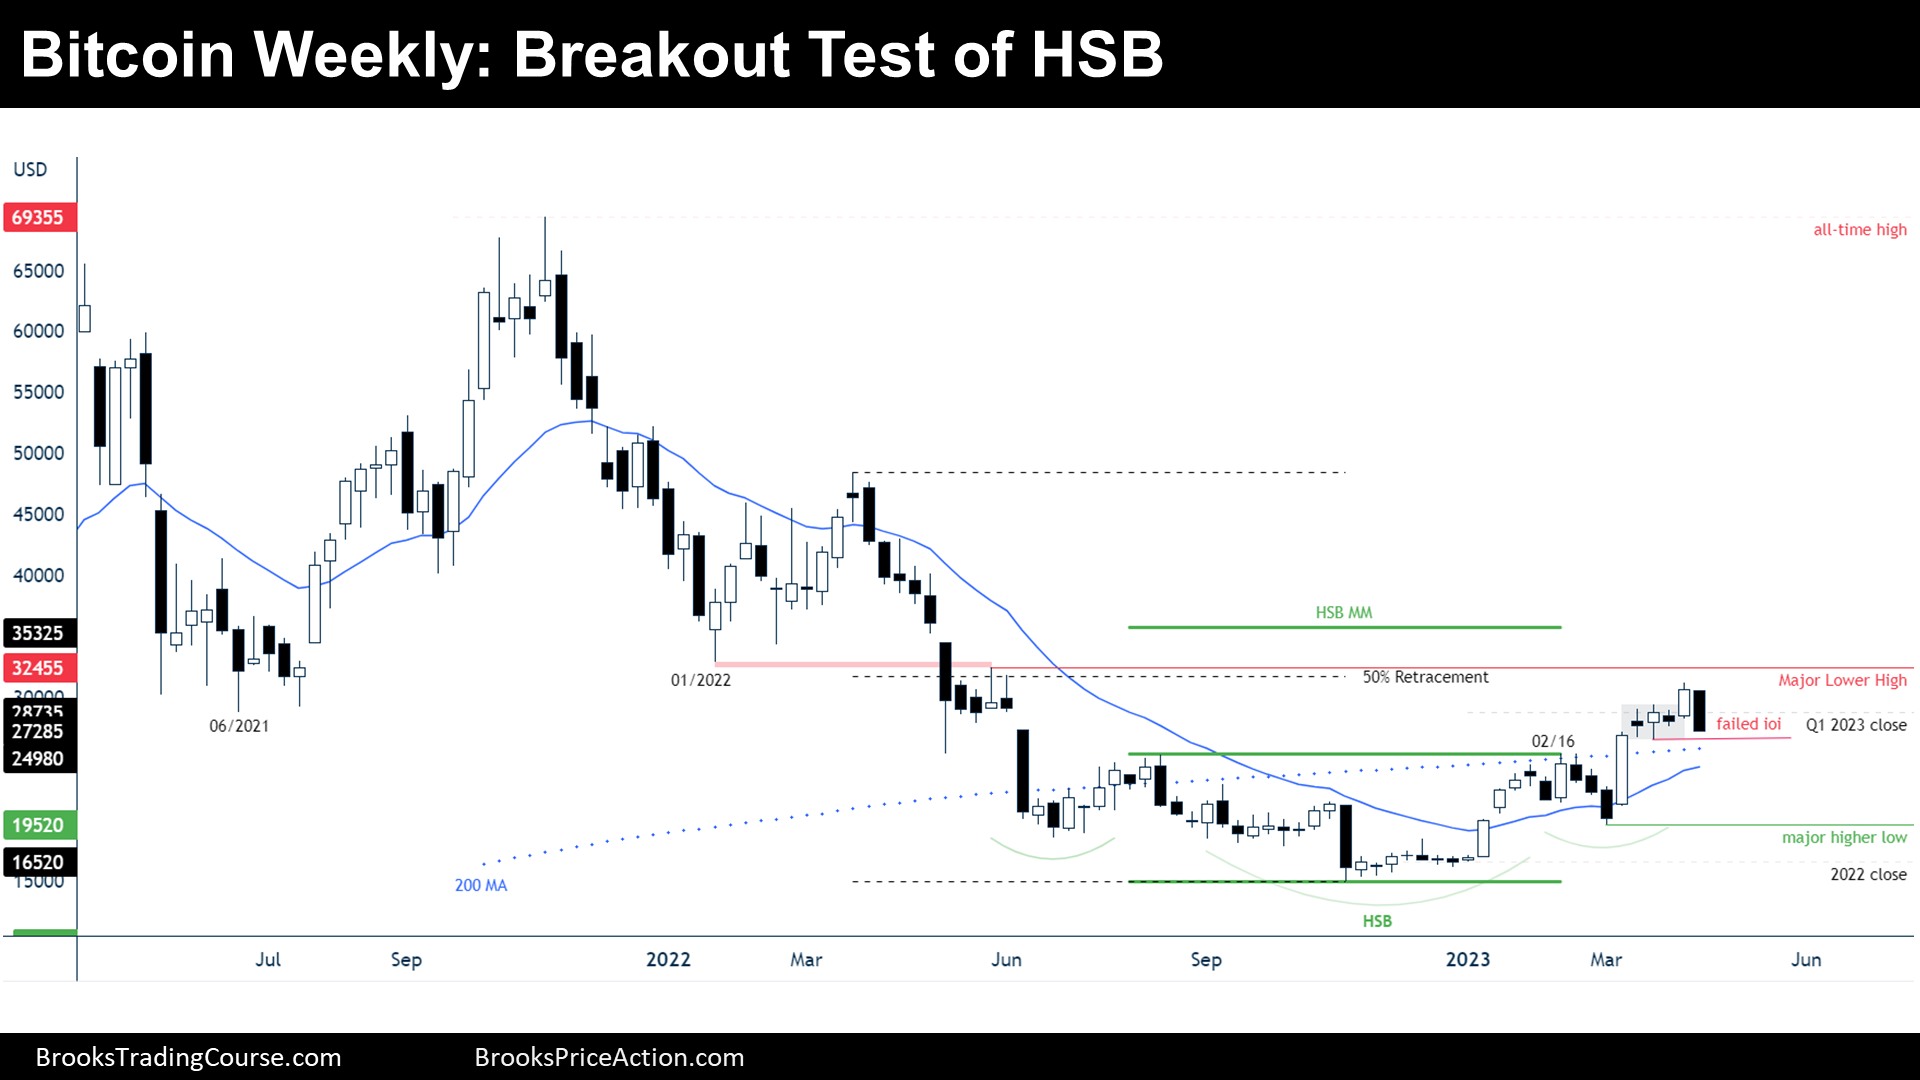
Bitcoin breakout test of HSB (Head and Shoulders Bottom). This week, the price decreased its value by -11.16%. The next week is the last trading week of April; So far, April is a small bear reversal bar.
Bitcoin futures
The Weekly chart of Bitcoin futures

Analysis
- This weekly candlestick is a strong bear breakout bar. It closed far below the last week’s low; bears were forceful since the high of the bar is exactly at the open of the bar.
- Last week, we have said that the ioi bull breakout will likely fail and that this week the price would likely decrease, and this is what happened.
- Lately, the price is trying a breakout of a Head and Shoulders Bottom (HSB) pattern, while the market cycle is probably a trading range.
- During trading ranges, breakouts tend to fail. Will this breakout fail? That’s precisely what is in play now, since the price is testing the breakout point of the February 16th high.
- Furthermore, the price is near the low of an ioi pattern after a bull breakout. That means that at the low of the pattern, there is the stop loss of the bulls who bought the breakout; hence, it is a sell signal.
- On the left of the chart, there is a strong bear channel: strong bear channels create sell zones, which are zones where bulls got trapped, and will try to get out when the price rallies back there: then, they sell.
- Nowadays, the different participant’s perspective might look something like this:
- Bulls:
- They want a reversal up to fresh 2023 highs. Preferably, without closing the gap between the current price and the February 16th high: that will mean that selling above highs is a losing strategy, that bears are losers.
- If they get to the HSB Measured Move (HSB MM), it will mean that breakouts succeed and that will validate the Major Trend Reversal thesis.
- The Major Trend Reversal thesis gets invalidated if the price trades below the major higher low.
- Bears:
- First, they want to activate the failed ioi sell setup.
- Then, close the gap between the price and the February 16th high. If they close the gap, it would mean that buyers are not as strong as they could be, and they will keep trying to sell while the price goes up.
- Ultimately, they intend to get to the major higher low: the market cycle is probably a trading range, and hence, the price is more likely to close gaps than to achieve breakout goals.
- Bulls:
- Since the trading range market cycle thesis is still valid, traders should expect the HSB breakout to fail; hence, during the next 20 bars (and current information) the price will probably get to the major higher low before it gets to the HSB MM. The next bar will likely have a bear body.
Trading
- Bulls:
- If the price trades below the ioi low, the stop loss will be triggered.
- However, they will give another chance to long if there is reversal up from the breakout test.
- Bears:
- They can sell reasonably below the current bear breakout bar, or below the ioi. Their stop loss is at 2023 highs and their goal is to get to the major higher low.
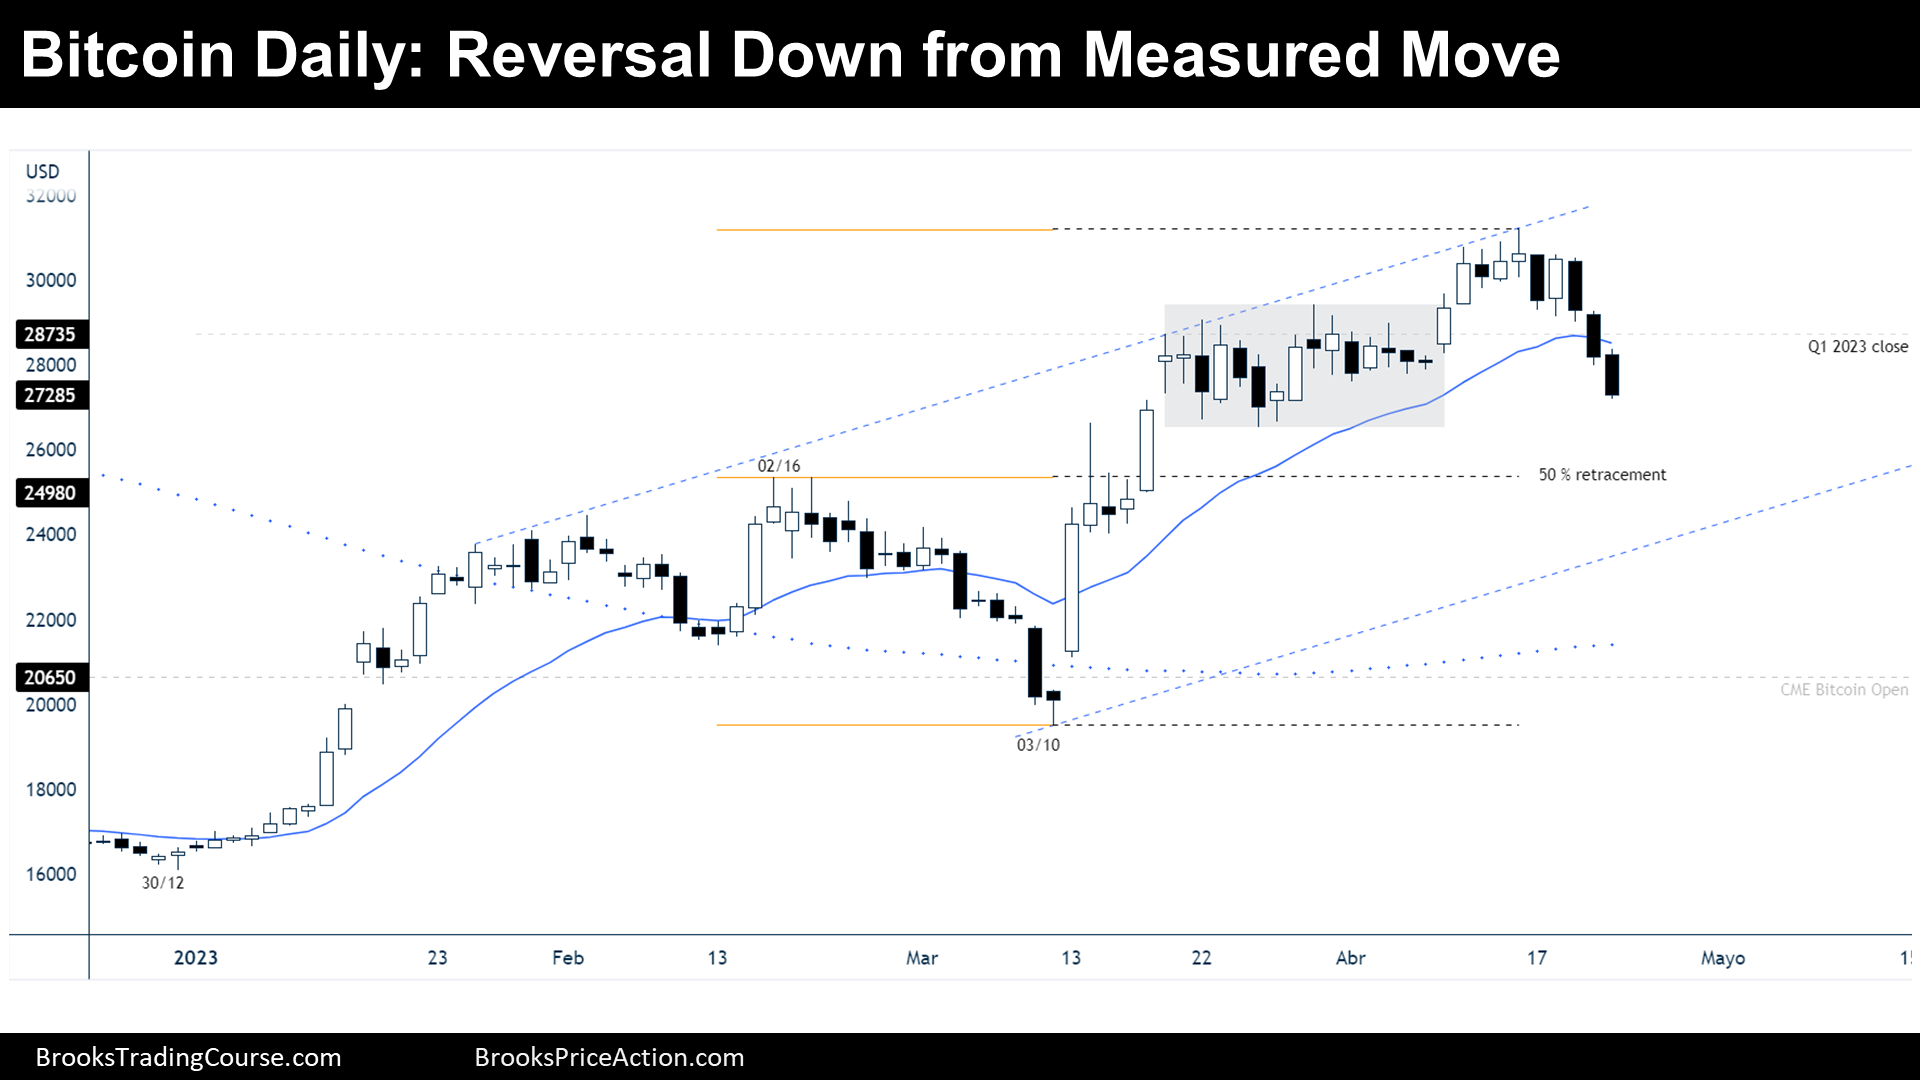
The Daily chart of Bitcoin futures

Analysis
- During the week, the price reversed down strongly. The last three bars are three consecutive bear breakout bars, meaning that a strong Bear Breakout is in play.
- The bears closed two consecutive bear bars below the 20 Exponential Moving Average (20 EMA).
- Bears are strong, there is overlap between bars and thus, gaps open: buying below bars is a losing strategy.
- There is a 60% chance that the Bear Breakout will probably create a measured move down based upon the height of the three consecutive bear bars, and hence, the price will likely trade below a 50% retracement based upon the prior tight bull channel.
- Nowadays, the different participant’s perspective might look something like this:
- Bulls:
- For them, the price is within a broad bull channel, and thus, they think that ultimately the price will hold within the bull channel and achieve higher highs.
- Bears:
- They think that instead of a broad bull channel, the price is already within a trading range, the low of the trading being around the 200-day moving average. If they are right, currently the price is high, and it is good to sell.
- Bulls:
- Since there is a Bear Breakout pattern in play, the price will likely trade sideways to down during the next week.
Trading
- Bulls:
- They need either strong bull breakout bars or a reversal pattern around a 50% pullback before considering to buy. Some might buy and scale in lower, knowing that if they use wide stops, they will likely make money.
- Bears:
- They can sell at the market or below bars or wait for a pullback and sell a Low 1, 2 or 3. Their stop loss above the 2023 highs or above the bear breakout. Their target is probably around $24000.
Market analysis reports archive
You can access all weekend reports on the Market Analysis page.