Market Overview: Bitcoin Futures
Bitcoin futures gapped up on the open of the Bitcoin first week of 2023 and ended with a +2.18% gain. During the last report, we explained in detail how the annual and monthly charts might influence the long-term landscape for Bitcoin.
Bitcoin futures
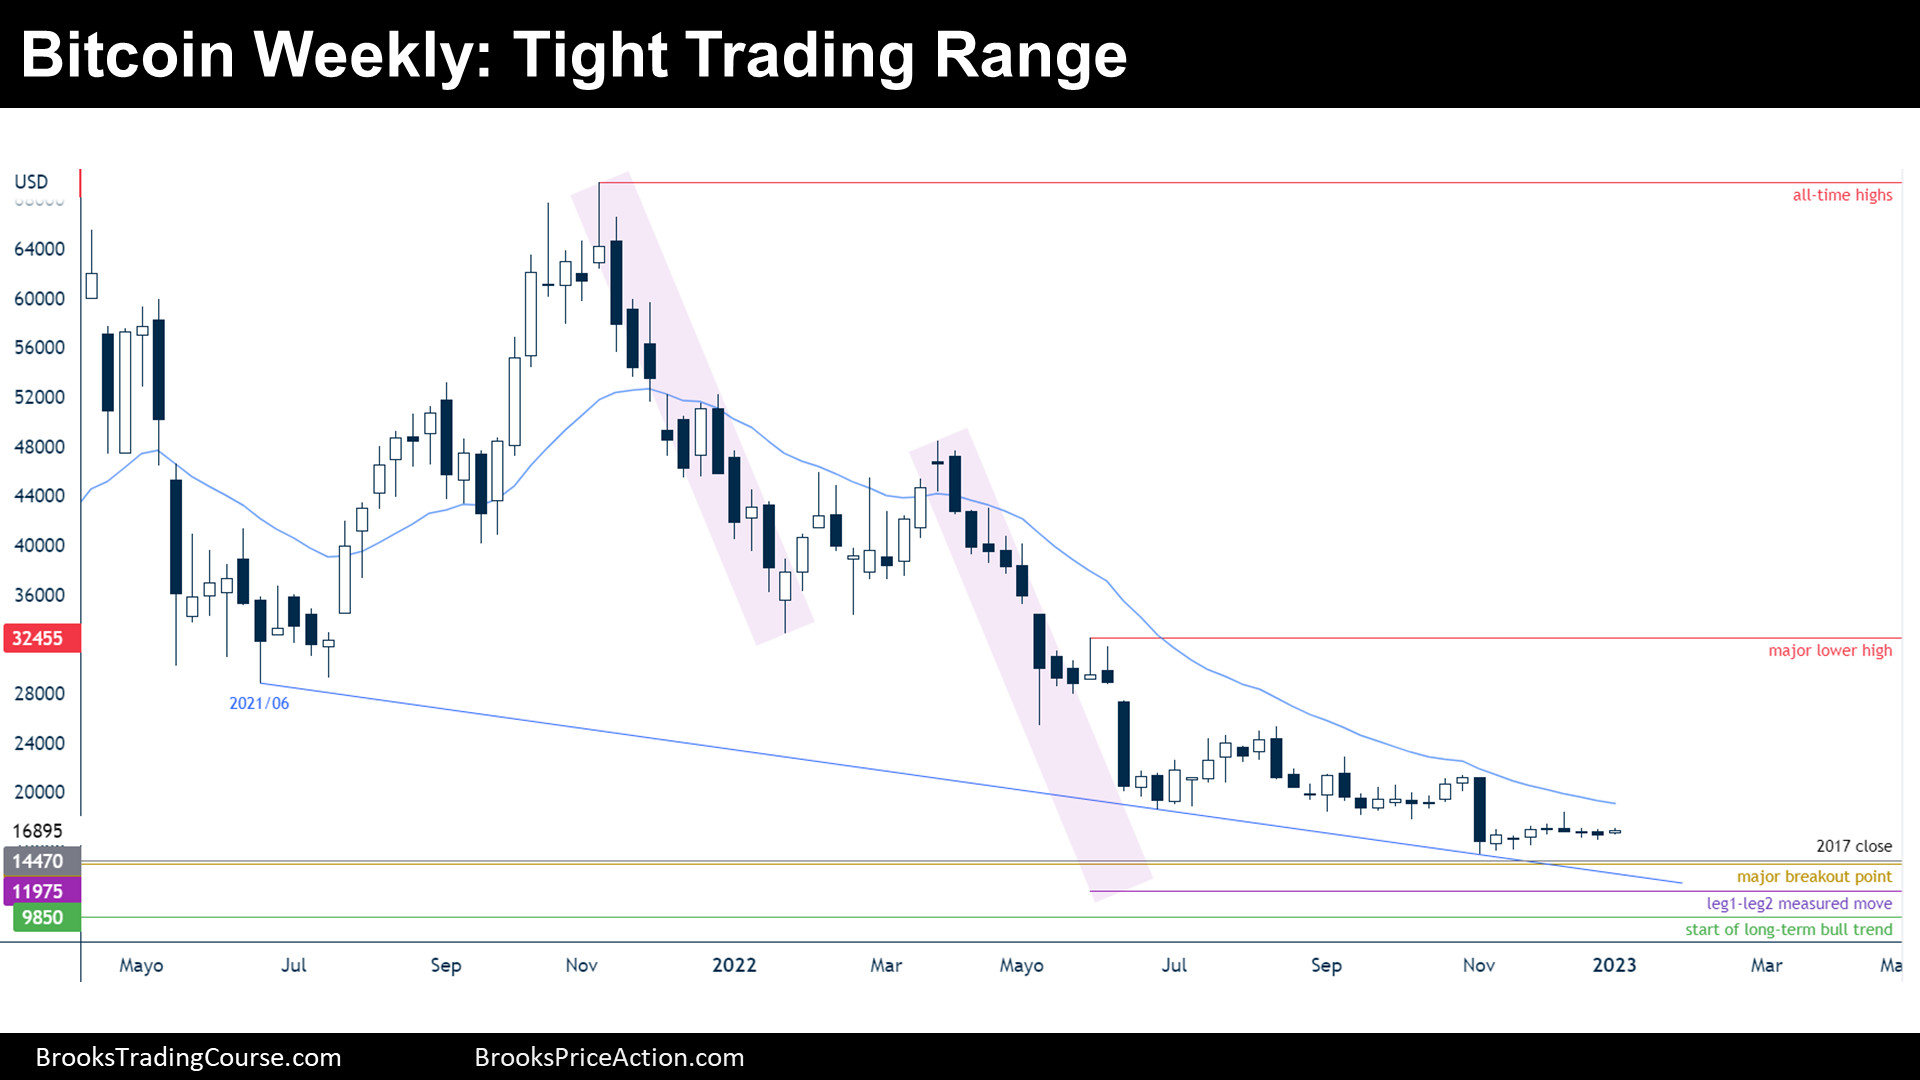
The Weekly chart of Bitcoin futures

Analysis
- Last week’s candlestick is a small bull doji.
- During the week, the price opened gapping up, then traded down, closing the gap with the prior close and reversed up ending the week higher.
- The first week of the year was positive for Bitcoin.
- The context is sideways to down trading late in a bear trend. It is considered late in a bear trend because during the bear trend there are more than 2 legs down already; thus, the trend might be exhausted.
- If the trend is indeed exhausted, the price is already within a trading range market cycle. Since on higher timeframes there is a strong bull trend on the left of the chart, the odds for a trading range market cycle increases.
- During trading ranges, a bear leg is normally followed by a bull leg, which is what should be expected to happen during the next 20 bars: during the first half of 2023.
- Trading ranges tend to test prior lows or highs, a test to the 2017 close or to the prior major breakout point should be expected: the same is true on the upper side, a test to the 2021 June low or the major lower high should be expected.
- Nowadays, the price is either:
- Bull case: the tight trading range from June 2022 to October 2022 is considered a final flag.
- Bear case: the current sideways trading is just a bear flag and the price will continue down to $9850 where the long-term bull trend will technically fail.
- The price is currently within a tight trading range, a tight trading range is a breakout mode pattern. There is a theoretical 50% chance that it will break on either side, but the odds favor slightly the bulls because the price sits above a long-term buy zone area, presumably the buy zone of the future trading range.
Trading
- Bulls and bears are waiting for clear setups, before acting they want a change of the price action behavior, for example strong breakout bars or bull bars followed by bull bars/bear bars followed by bear bars.
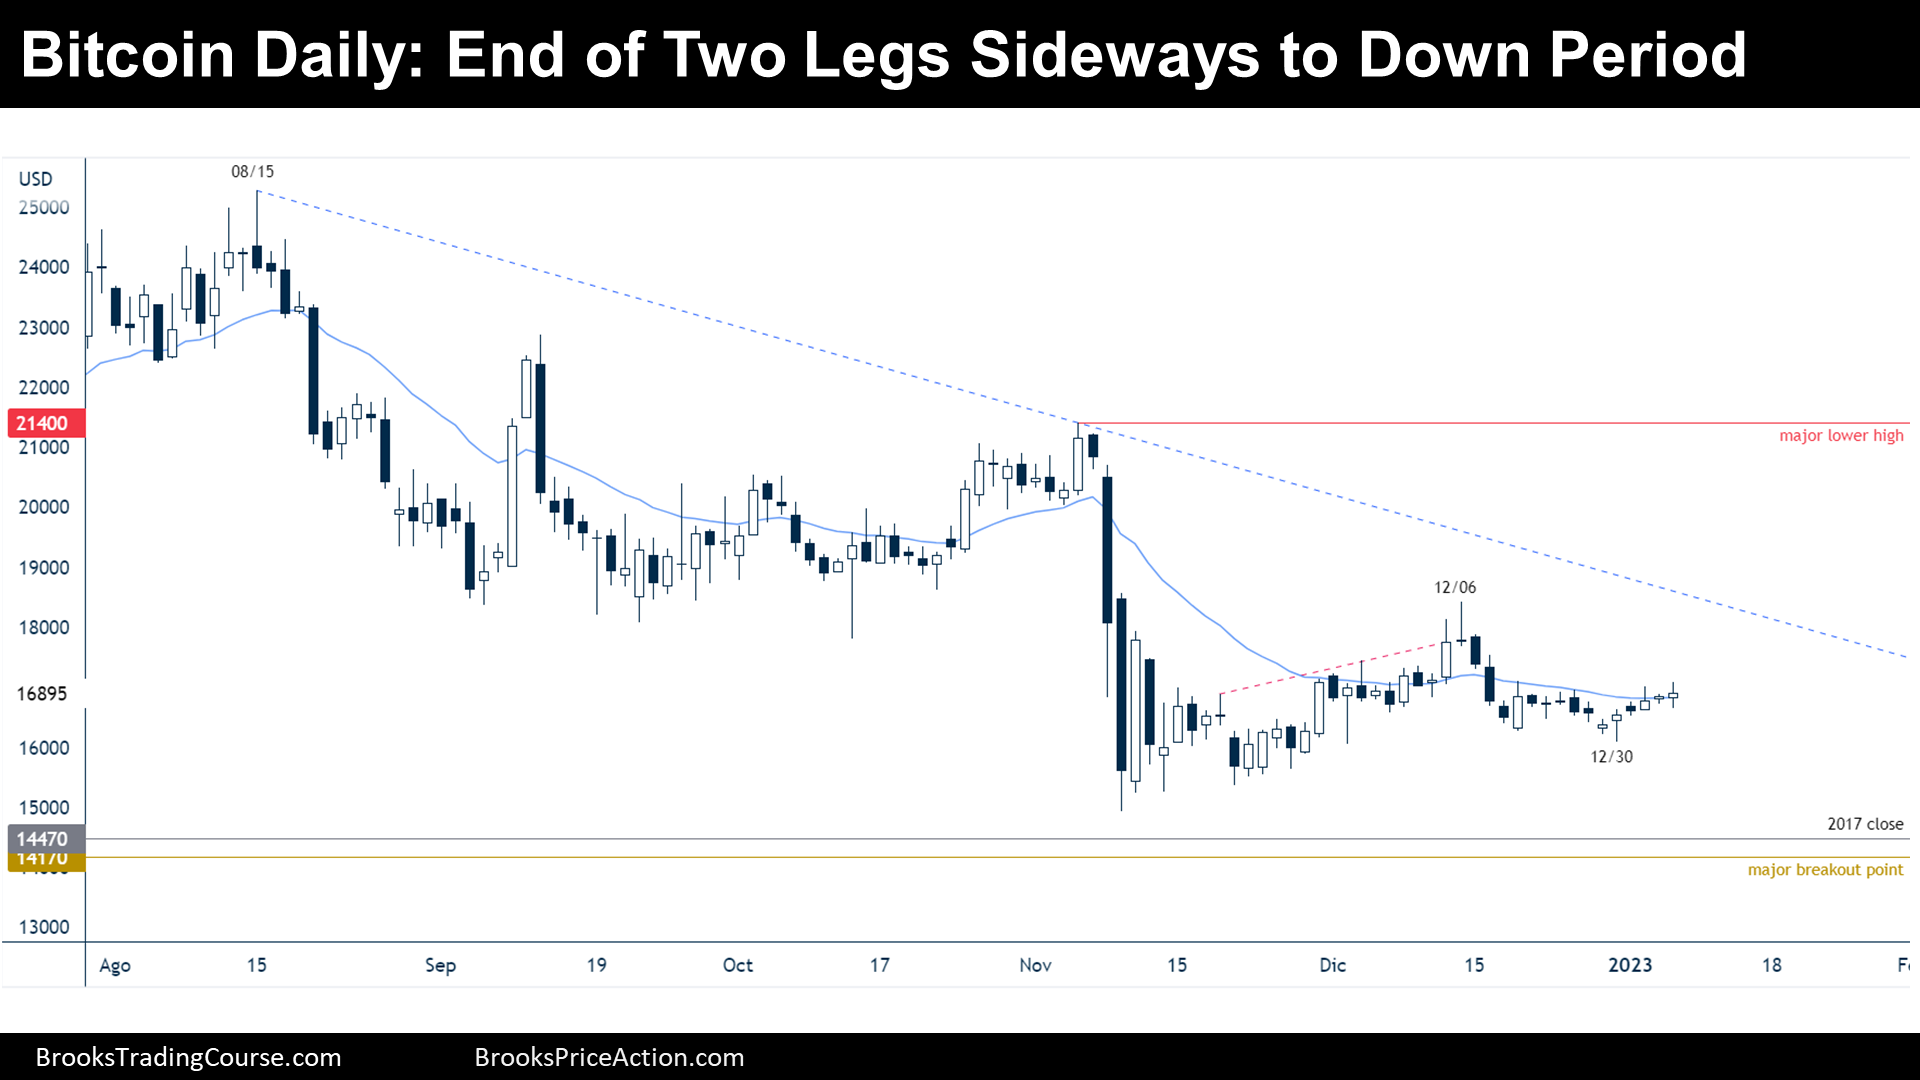
The Daily chart of Bitcoin futures

Analysis
- During the week, the Bitcoin futures price traded sideways to up.
- During the last report of 2022, I mentioned that the price was within a two legs sideways to down period, which is what happened. December 30 low was the end of the two legs sideways to down move.
- What should we expect after a two legged move?
- The bears reached their initial target, which is to get to the prior higher low. But their true target is the major higher low, in this case is the low of the wedge top, which was not achieved. Then, bears were not strong enough, and they might want to sell higher next time, which could mean that traders should expect a test of December 14 high before a test of 2022 lows.
- While what is mentioned above is the most likely scenario, the price is currently trading sideways and the market cycle is clearly a trading range. The unexpected should be expected, and the odds for bulls and bears are quite balanced.
- Nowadays, the price is either:
- Bull case: They hope December 30 is the low of a double bottom higher low major trend reversal, they want a bull breakout of the bear trend line and end the bearish inertia by trading at the prior major lower high.
- Bear case: Bears want a double top lower high with December 14 high, they aim, at least, to a move that will bring them to test the 2017 close or the long-term major breakout point.
Trading
- Currently, the market is probably within a limit order trading situation, they buy low, sell high, and take quick profits. Most traders should wait until there are strong breakout bars or consecutive bars in either direction before placing trades.
Market analysis reports archive
You can access all weekend reports on the Market Analysis page.