Market Overview: Bitcoin
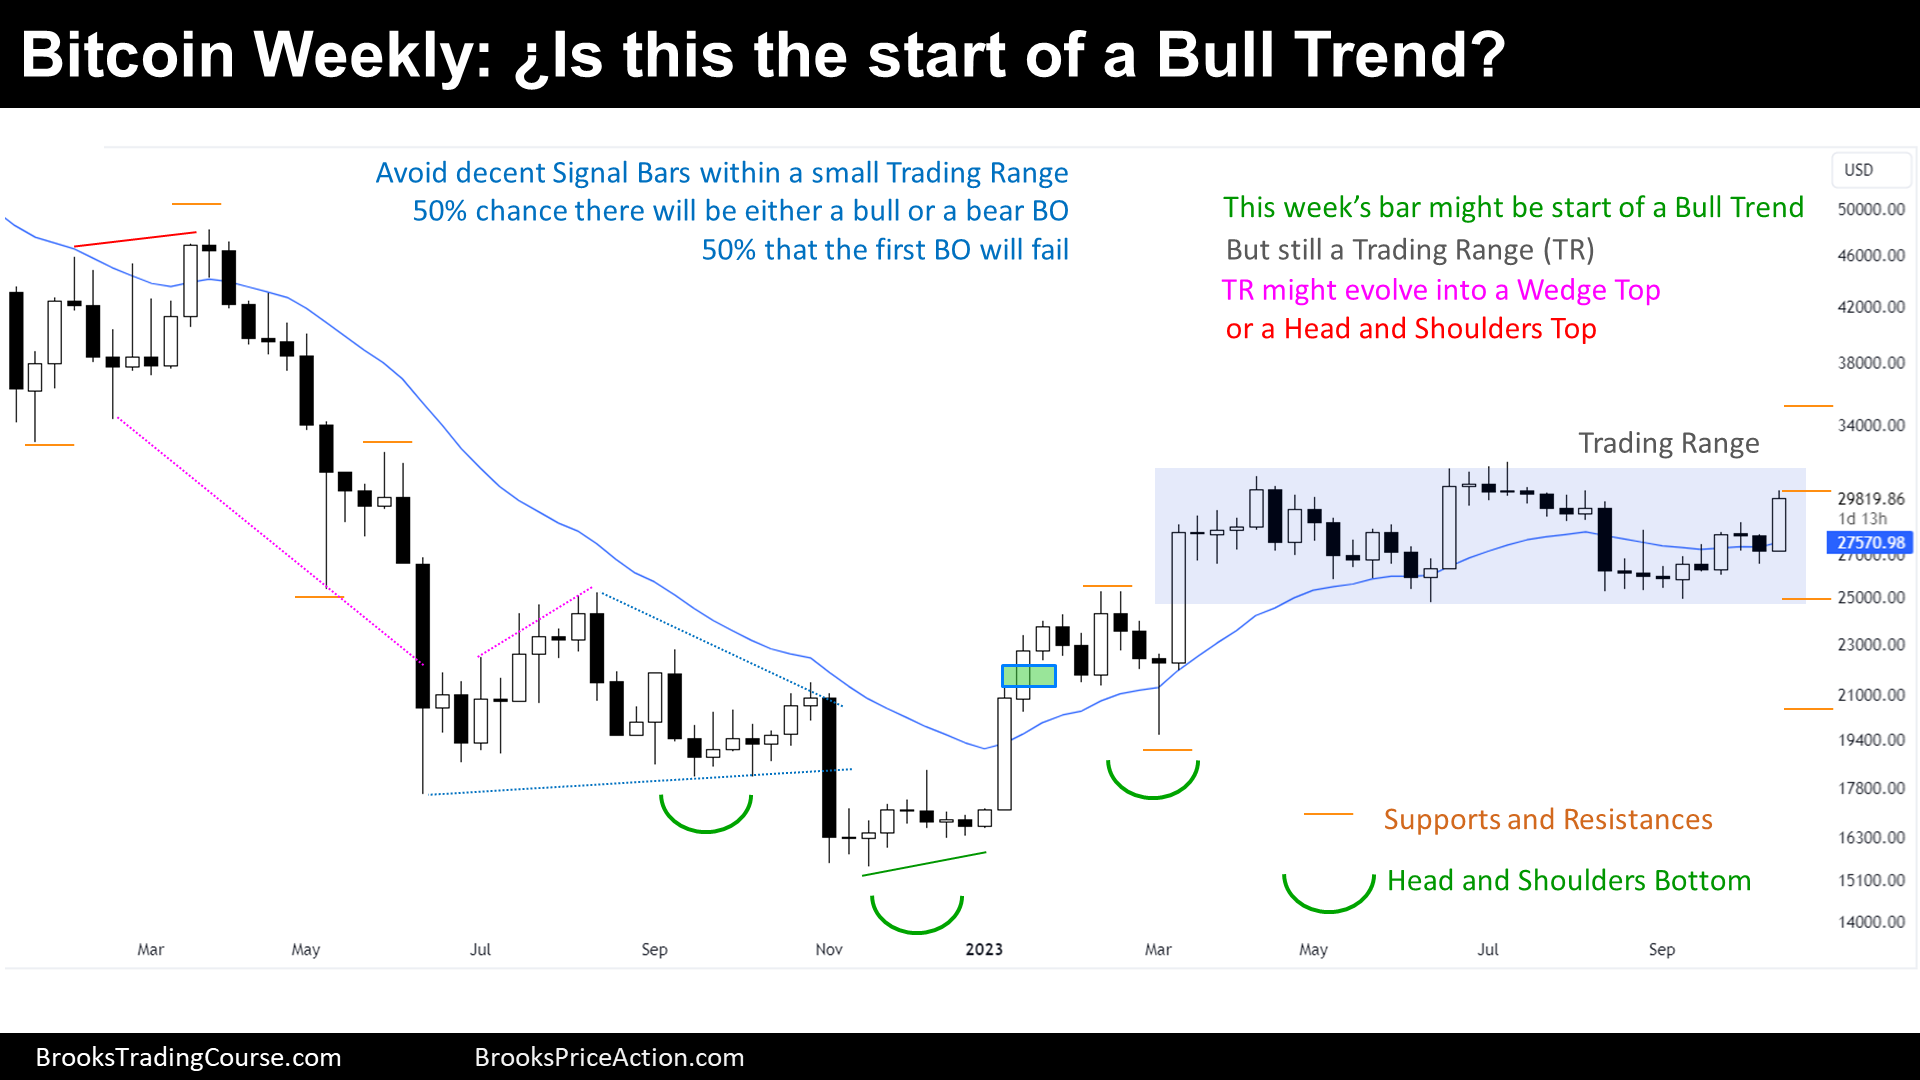
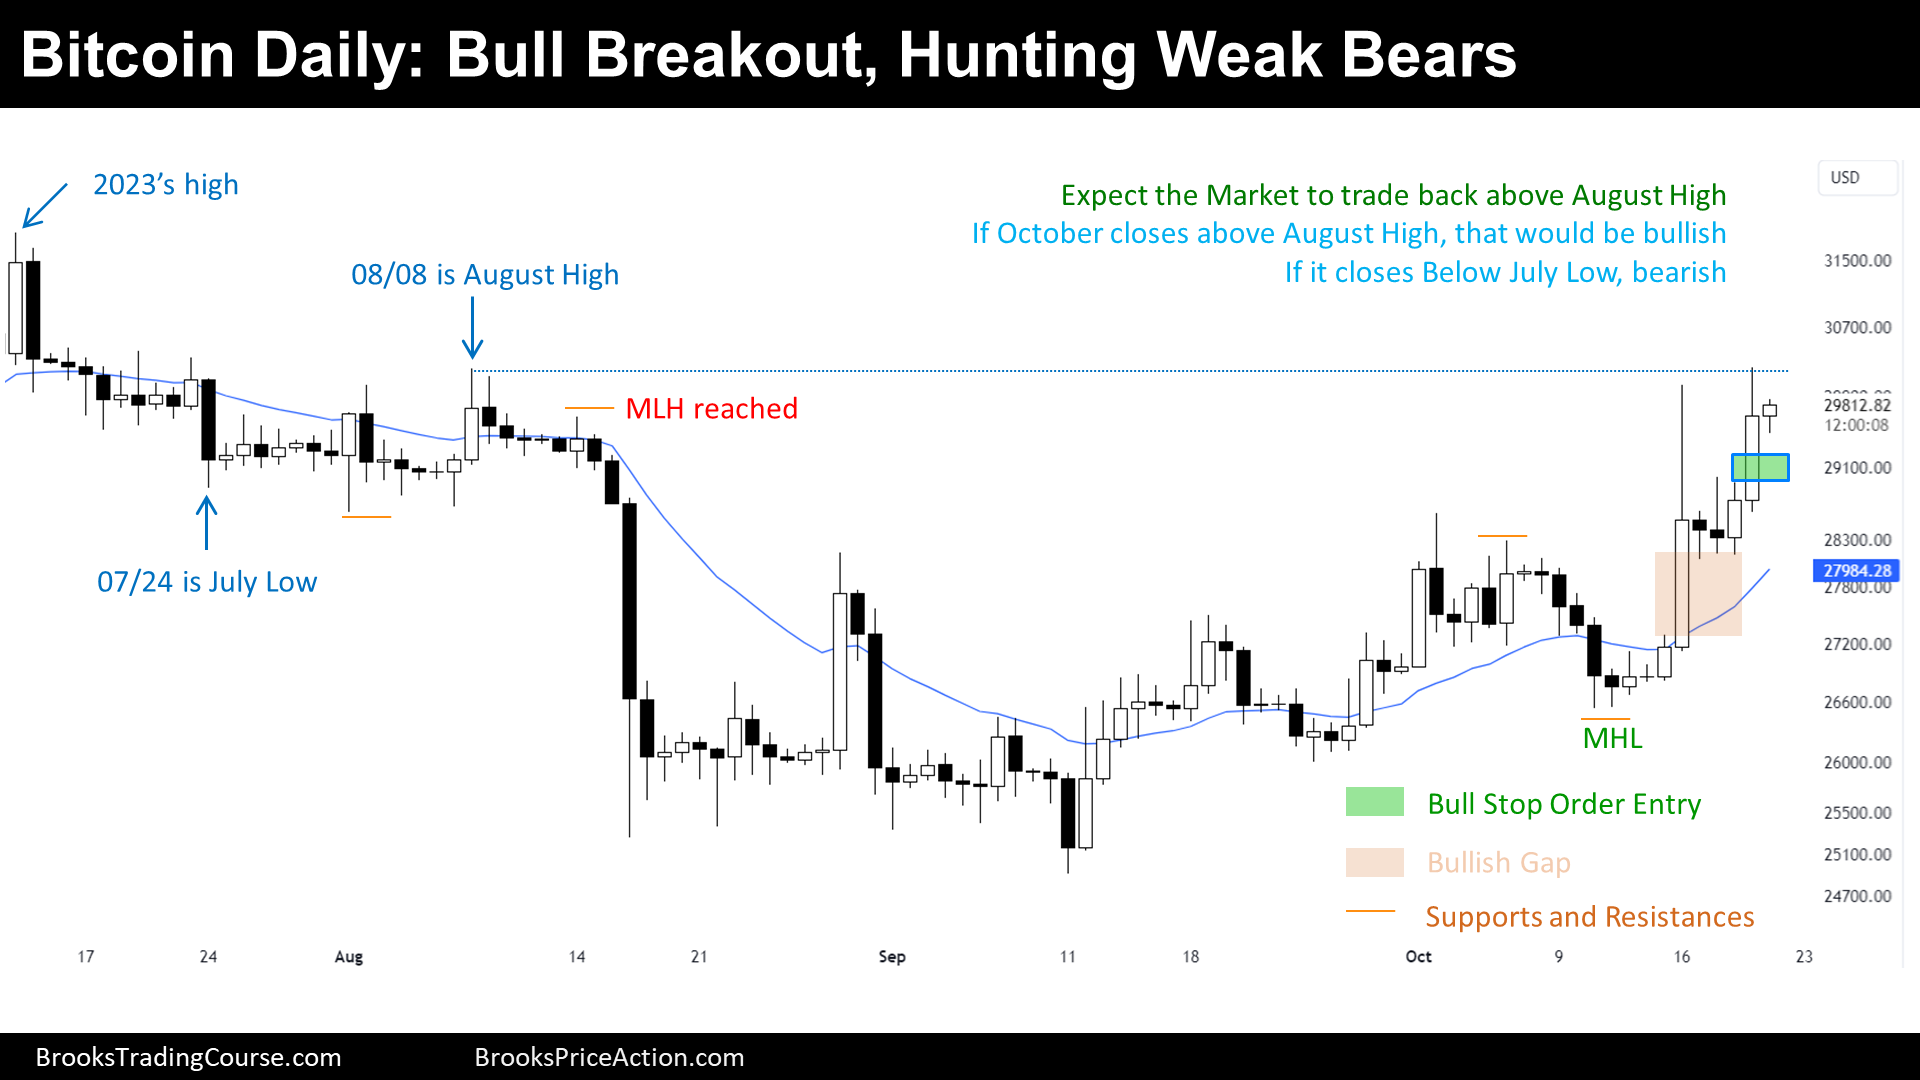
Bitcoin is testing $30000 big round number and the August High, during a hunt of weak bears on the daily chart. This week’s candlestick is a strong Bull Bar. Traders wonder if this is the start of a Bull Trend; however, it is too early to say since the price remains within a Trading Range and may form topping patterns like a Head and Shoulders Top if it reverses around here, or a Wedge Top if there is a new 2023 high.
Next week, Traders expect a test above this week’s high, which is around the August High, and where the hunt of the stop losses of Weak Bears is taking place on the daily chart.
As stated during the last report, there is a lot of speculation around the possibility of a Bitcoin ETF approval. A resolution will probably be the catalyst for the next swing trade on the weekly chart.
Bitcoin
The Weekly log chart of Bitcoin

Past: Support and Resistances
- The price started a Strong Bear Channel:
- Bear Flag’s Breakout Point.
- Major Lower High.
- Then, failed a Breakout Below a Bear Flag and Reversed up, forming a HSB (Head and Shoulder Bottom) pattern, that broke up:
- 2022 Low.
- 2022s Major Higher Low.
- 2023 Major Higher Low.
- HSB Breakout Point
- Lately, the price has been sideways creating a Double Top and a Double Bottom, which is a Trading Range, a small Trading Range (not Tight Trading Range).
- Trading Range High.
- Trading Range Low.
Present: Market Cycle
Trading Ranges tend to break when they are exhausted if they are wide, and with a strong Breakout, when they are small like this one.
- This week’s candlestick is a pretty good bull breakout bar, that might start a Bull trend.
- However, the price is still within a Trading Range.
- If there is a reversal before there is a 2023 high, it will form a Head and Shoulders Top pattern.
- If there is a new 2023 high, it forms a Wedge Top pattern.
Future: Inertia
The first breakout of a Trading Range has only a 50% chance of being successful. If there is a strong bull breakout above the Trading Range next week, there would be two strong consecutive bull bars and hence, the probability of success will be higher.
However, the price is still within a Trading Range, where good signal bars, like this one, are usually faded. If it is not faded, Traders will take note and start wondering if this is the start of a Bull Trend.
Trading
The price is within a Trading Range, patience is key. Most Traders should wait until there is a strong breakout, relatively far above the 2023 high, before buying.
- Bulls:
- Some are anticipating a Bull Breakout, they see a double bottom higher low, a good buy signal bar.
- Some others are placing buy stop orders above 2023 high.
- This tactic has higher probabilities than the one above.
The Daily log chart of Bitcoin

Past: Support and Resistances
- The price started a Strong Bear Breakout of Tight Trading Range:
- 2023 high.
- Major Lower High (MLH).
- Soon after, before bears achieved a Measured Move down, and entered a Trading Range Market Cycle.
- After a Leg 1 equals Leg 2 Measured Move, we anticipated a move towards the apex of the Trading Range.
- Last week, we have said that the odds of going up or down were 50%.
- This week, the price did a surprise breakout above the prior major lower high.
- Major Higher Low.
- Gap.
Present: Market Cycle
- The market changed its behavior respecting the prior weeks. This week, the price went above the Major Lower High, hunting the stop losses of weak bears. Weak bears moved their stop losses above the August High, or the 2023 High.
- Why is this important now?:
- By trading above the August high, the bearish dynamic is over and bulls are now in control.
- And when bulls are in control, the price tends to test prior highs. Which is also a hunt of weak bears.
- By trading above the August high, the bearish dynamic is over and bulls are now in control.
A hunt of weak bears means testing prior highs. A hunt of weak bulls means testing prior lows.
Future: Inertia
Traders should expect another test above this week’s high during the following days.
- The real deal is what would happen when there is the Monthly candlestick closes.
- Bulls want to hold and keep trending up above the August high.
- Bears wish to reverse down and close above the July Low.
Trading
Based upon today’s information, Traders will look to buy intraday pullbacks during Monday or Tuesday.
- Bulls:
- They will look to buy with stop orders above buy signal bars, up to the 2023 high.
- There is a Bull Gap open, which means that maintaining a stop loss below the Major Higher Low can allow them to buy a deep retracement, aiming to test this week’s daily highs.
- They will look to buy with stop orders above buy signal bars, up to the 2023 high.
- Bears:
- They see a Wedge Top, they think that the Strong Bulls will sell their longs, that this is why there is a hunt of weak bears going on.
- However, they probably should wait to sell a reversal after higher prices, since the price it is likely to trade through the August High again.
Market analysis reports archive
You can access all the weekend reports on the Market Analysis page.
Josep, I read your report when it posted and just reread it. Thanks again for your insight.
Hola Elijah, thank you for your comment. Promising weeks ahead, it looks like a swing is emerging, either from a successful bull breakout or from a failed bull breakout.
See you next report! 😀