Market Overview: Bitcoin
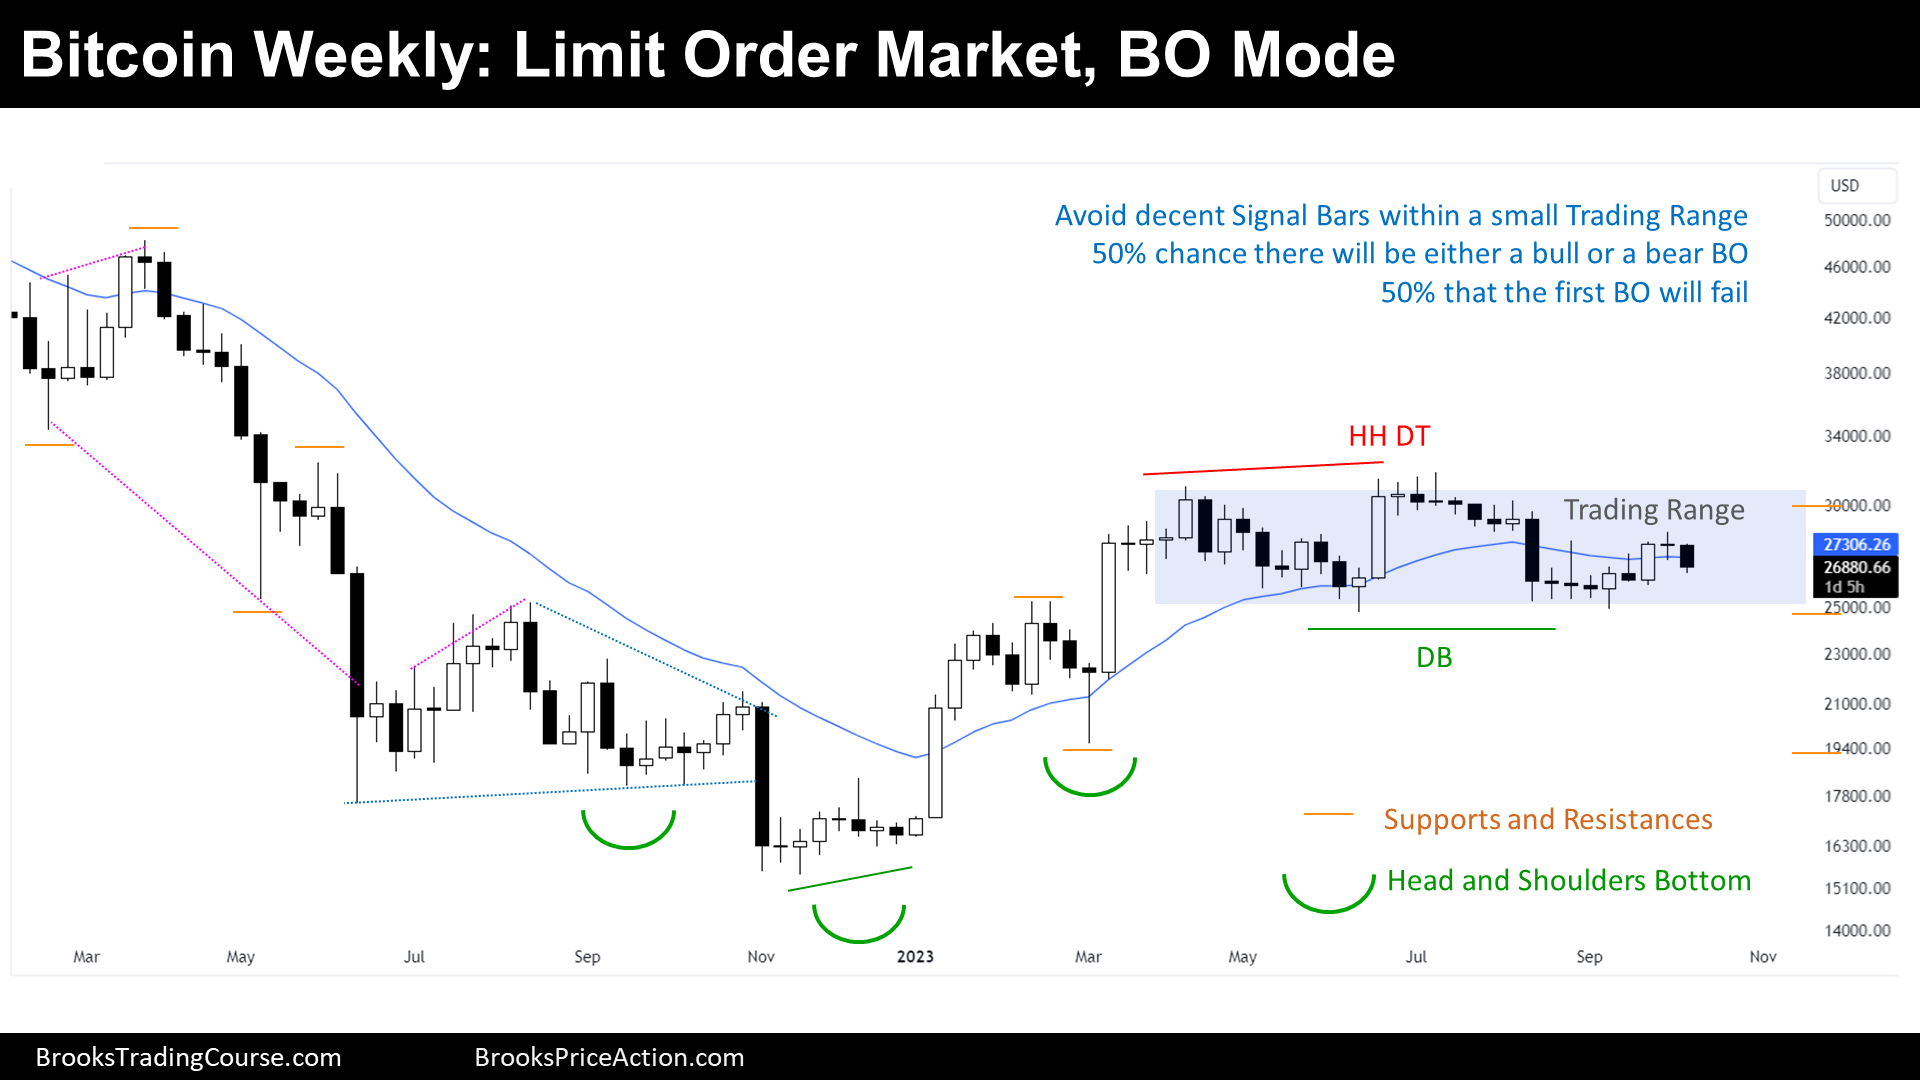
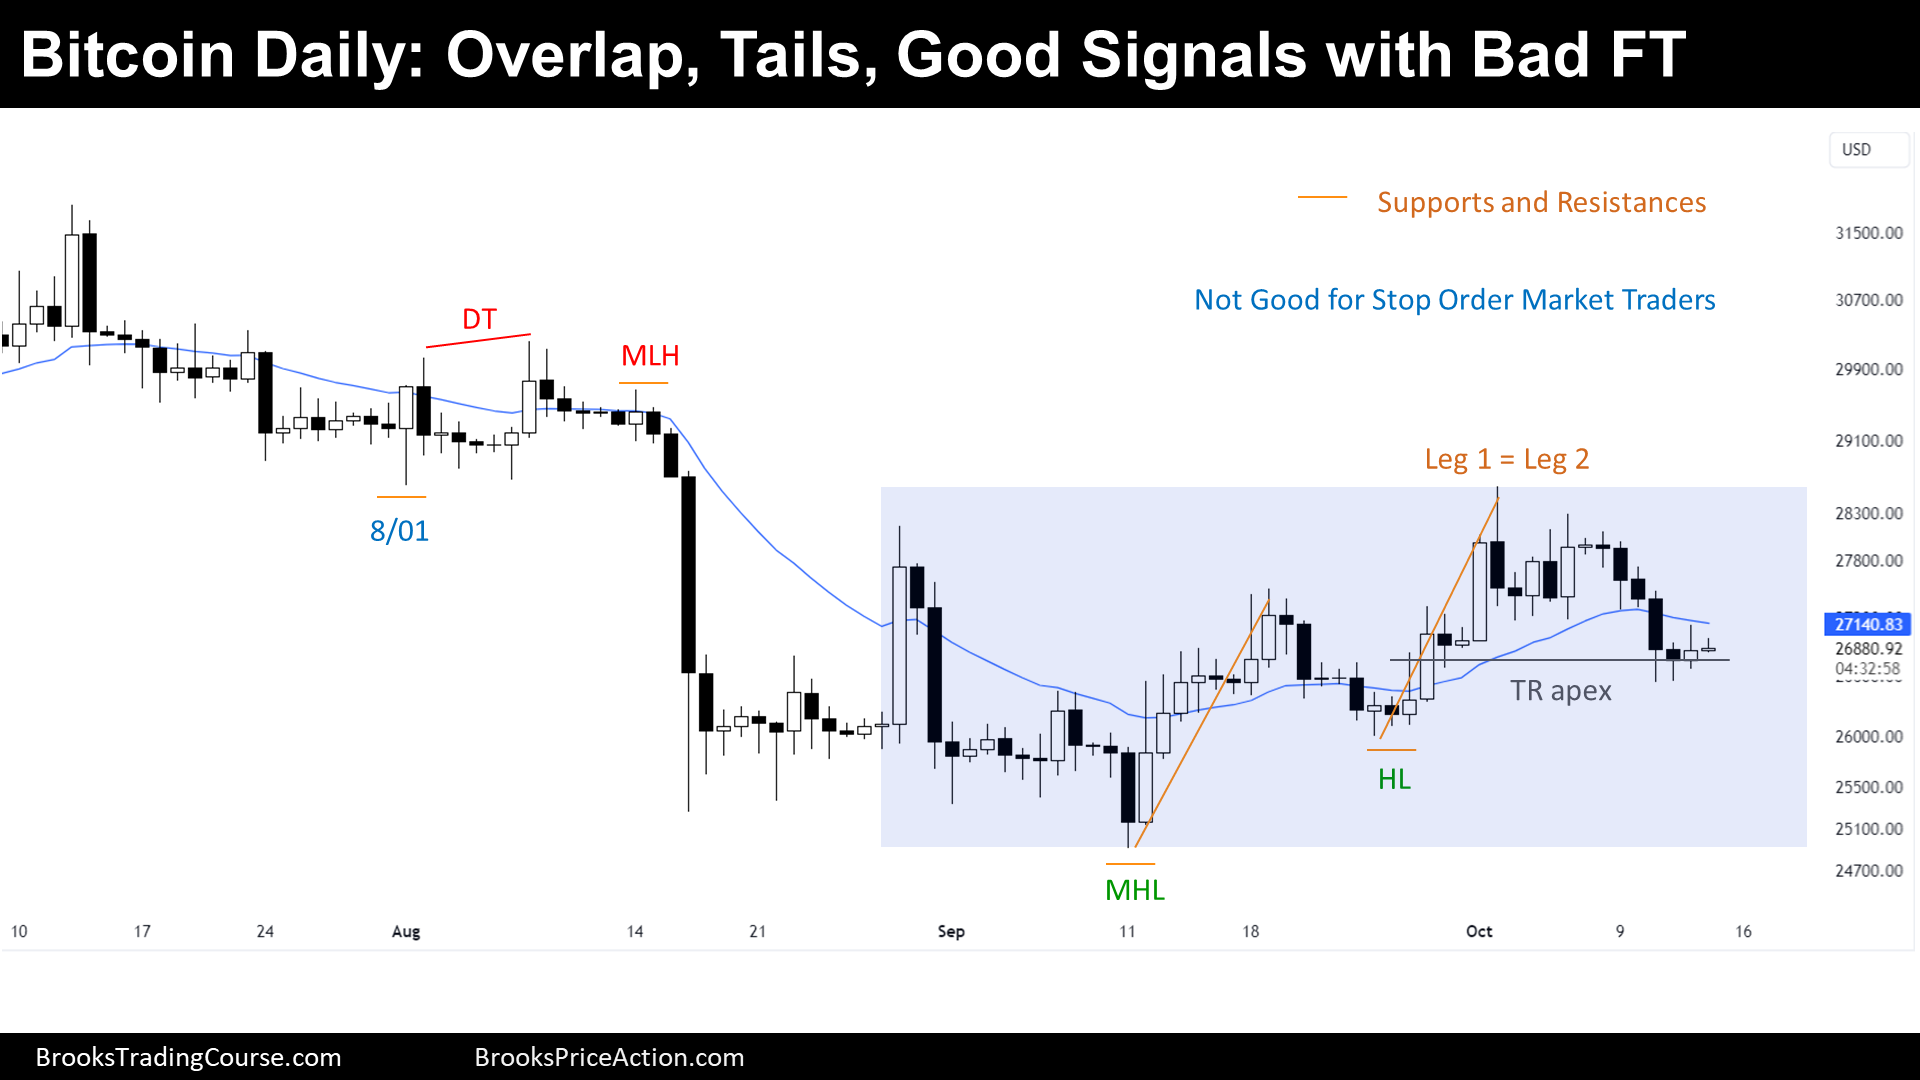
Bitcoin test down of a Daily chart magnet. During the past report, we have said that the price was likely to test the apex of a Trading Range on the Daily chart, and this is what happened during the week. Regarding the weekly chart, there is a bear signal bar, but since the price is around the middle of a small Trading Range, the context is not good to start shorts.
Trading Range both on the Daily and Weekly charts, the market is in seek of a catalyst to start a Breakout, which might be a resolution regarding the Bitcoin ETF approval.
Bitcoin
The Weekly logarithmic chart of Bitcoin

Past: Support and Resistances
- The price started a Strong Bear Channel:
- Bear Flag’s Breakout Point.
- Major Lower High.
- Then, failed a Breakout Below a Bear Flag and Reversed up, forming a HSB (Head and Shoulder Bottom) pattern, that broke up:
- 2022 Low.
- 2022s Major Higher Low.
- 2023 Major Higher Low.
- HSB Breakout Point
- Lately, the price has been sideways creating a Double Top and a Double Bottom, which is a Trading Range, a small Trading Range (not Tight Trading Range).
- Trading Range High.
- Trading Range Low.
Present: Market Cycle
Trading Ranges tend to break when they are exhausted if they are wide, and with a strong Breakout, when they are small like this one.
Future: Inertia
Based upon what we have said during the end of the quarterly report, this first swing up or down will likely fail.
However, usually, there is a 50% chance that the first Breakout of a Trading Range will fail. 50% chance that a Bull or a Bear Breakout will be successful.
At some point, there will be a series of consecutive bull bars, or consecutive bear bars, that will anticipate a swing.
Trading
Traders want a swing up or down, and will probably wait for a couple of strong consecutive bars, one side or the other, before Trading.
The Daily logarithmic chart of Bitcoin

Past: Support and Resistances
- The price started a Strong Bear Breakout of Tight Trading Range:
- Major Lower High (MLH).
- August 1st Breakout Point.
- However, soon after, before bears achieved a Measured Move down, bulls did a Bull Surprise but it was a Bull Trap, Scale In Bulls and Bears sold at 50% Pullback. Finally, the price did a 5 Bull Micro Channel that broke above a prior minor Lower High:
- Major Higher Low (MHL).
- That Bull Leg (Leg 1) was not specially strong, since all Bull Bars had tails at the top. The Bull Leg retraced a 50% and then a Leg 2 surged:
- Higher Low (HL).
- Trading Range Apex.
Present: Market Cycle
The market cycle looks like a Trading Range, good bull bars are followed by bear bars or dojis. Good bear bars are followed by bull bars or dojis. Breakouts fail. Traders selling above prior minor highs, or buying below prior minor lows, are making money if they scale in: this is exactly how the price behaves under Trading Range conditions.
Future: Inertia
In Trading Ranges, a Bull Leg is normally followed by a Bear Leg and vice versa. Moreover, the price tends to test the apex of the Trading Range, since it is considered a fair price.
During the past report, we have said that the price was more likely to test down the Trading Range Apex than a third leg up. Here, the odds of going up or down are 50%.
Trading
Stop Order Traders will be interested around the Trading Range high or low.
Market analysis reports archive
You can access all weekend reports on the Market Analysis page.