Market Overview: Bitcoin
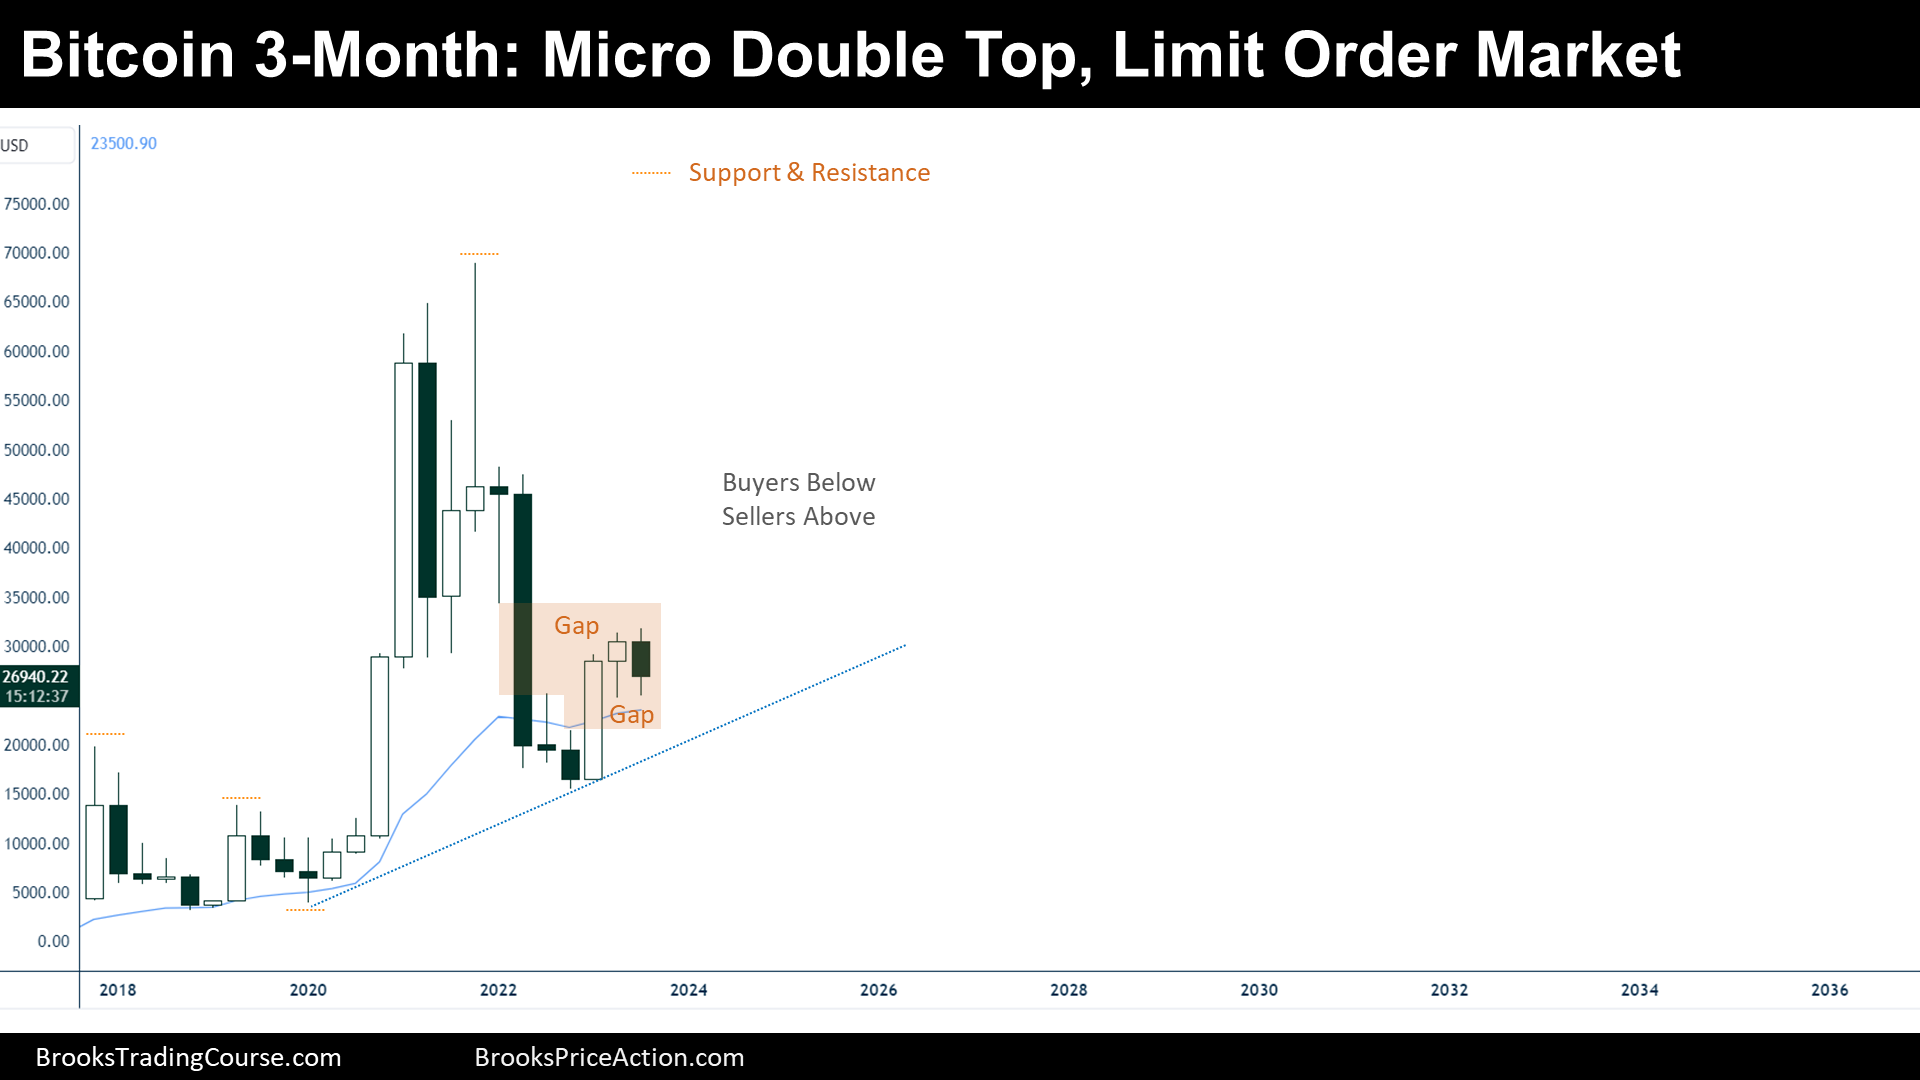
Bitcoin traded above past Q (Quarter) high during the Q3 (3rd Quarter), and then reversed down, creating a micro double top. On the Monthly chart, Bitcoin is within a Tight Trading Range, which is a Breakout Mode pattern: there is a 50% chance that the price will have a successful breakout above or below, a 50% chance that it will reverse. Traders look for a swing up or down, bulls see a micro double bottom and a continuation of a bull trend (2023 swing up), bears see a micro double top and a bull leg that it is stalling at a resistance.
Bitcoin Spot (24/7, 365-day chart)
The Quarterly chart of Bitcoin

Past: Supports and Resistances
- Bitcoin did a strong bull breakout of the top of a Triangle:
- 2017s high, 2019s high.
- Major Higher Low at 2020s low.
- Then, the price reversed down strongly within a two legged move:
- 2nd leg high (all-time high).
- Thereafter, the price reversed up at support (test of 2017s high).
- Minor Bull Trend line.
Present: Market Cycle
After the strong bull breakout of the Triangle, Traders sold a big bull trend bar (Q1 2021), bought around the low, and sold the high again: Limit Order Market.
¿Is the market continuing to behave like a Limit Order Market?
Q2 2022 was a strong bear bar, that had bad follow through and followed by a strong bull bar on Q1 2023 and a bull bar during the Q2 2023. Therefore, it seems like the Limit Order Market is continuing. Traders buy below things, and sell above things.
Future: Inertia
A Limit Order Market tends to form a Trading Range pattern. It could be a Triangle, contracting or expanding, a Rectangle or a Head and Shoulders Bottom. Since the volatility is high and the Trading Range Pattern will be wide, Traders won’t expect a trend until the Trading Range is exhausted, which means a contraction.
Strong legs up and down will probably be faded.
Bitcoin might trade sideways, gravitating around the apex of the Trading Range pattern, during years.
Investing
Those who support the Bitcoin thesis and are willing to buy and Hodl, are going to accumulate while the price is below $35000 during the upcoming years.
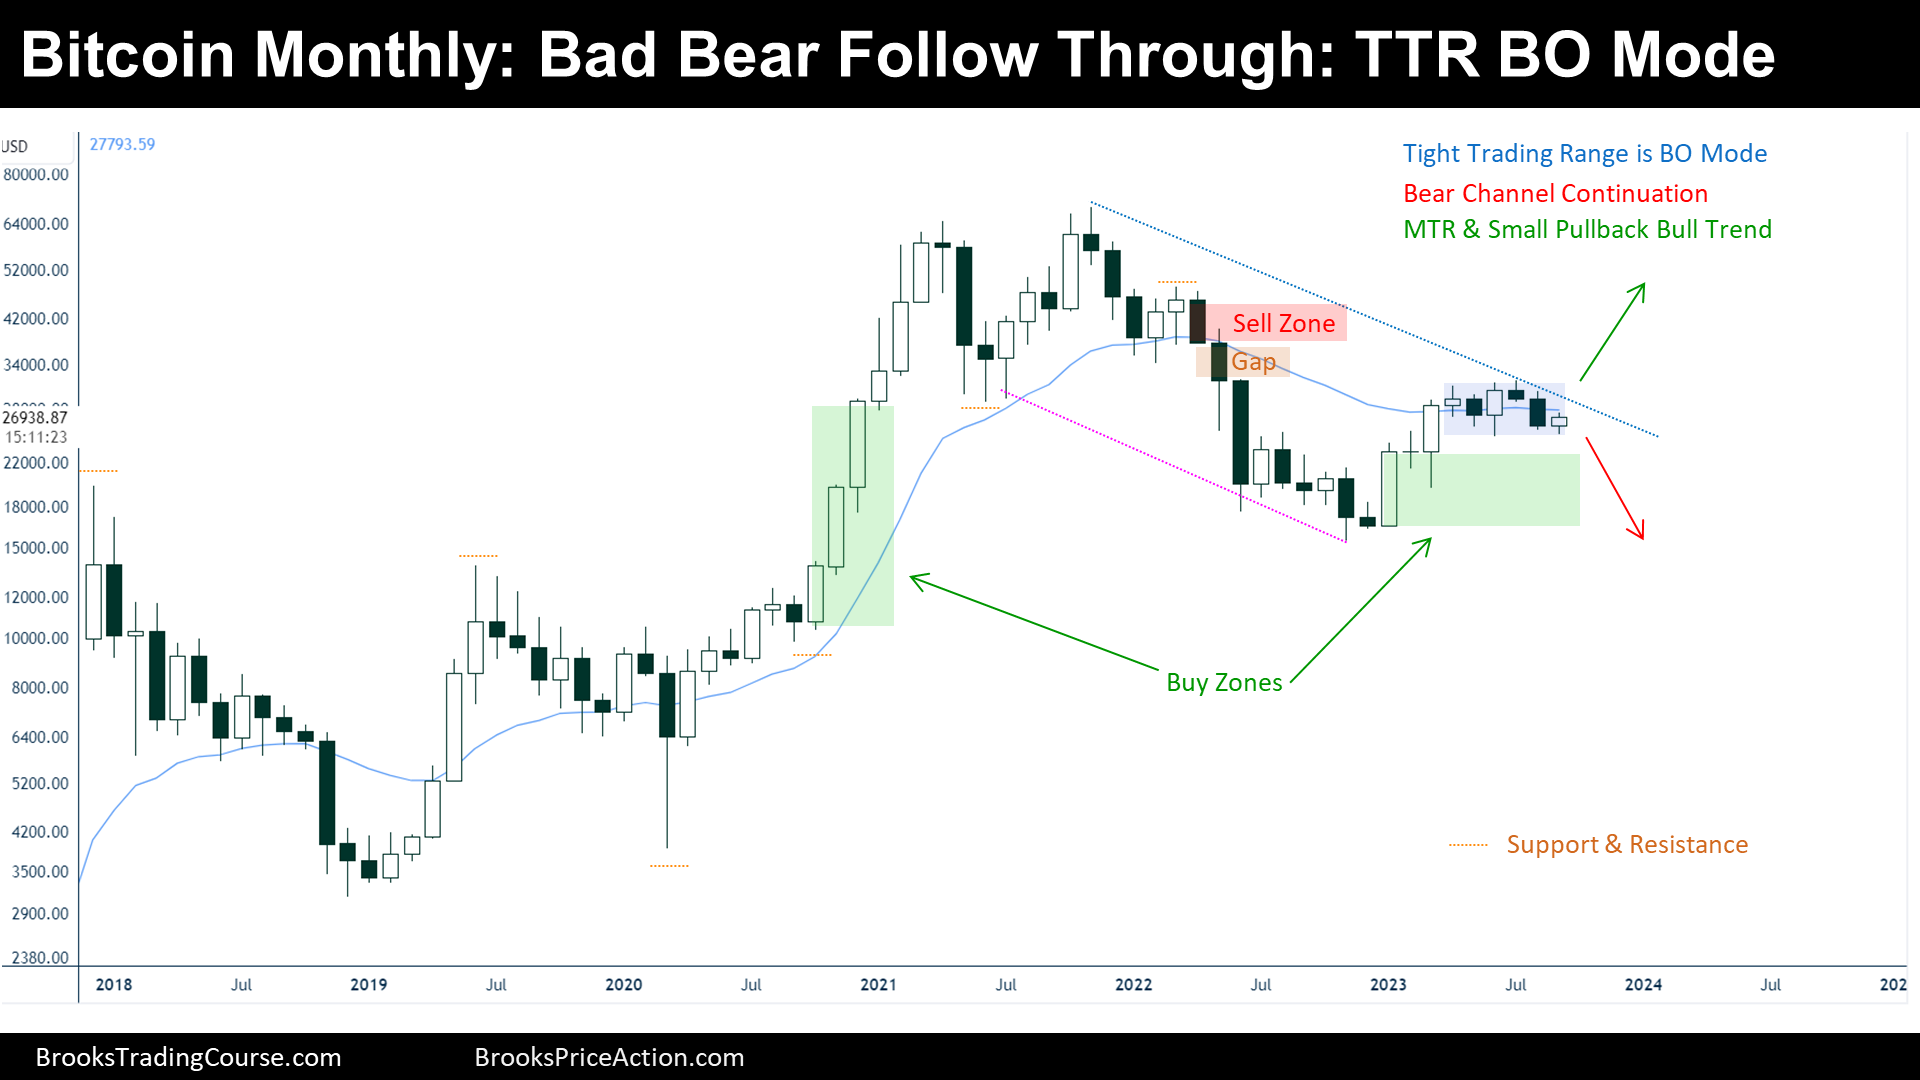
The logarithmic Monthly chart of Bitcoin

Past: Supports and Resistances
- Bitcoin did a strong bull breakout of a Trading Range that lasted from 2017 until 2020.
- 2017s high.
- 2019s high.
- Bull Breakout Low (Major Higher Low).
- Three consecutive Bull Breakout Bars breaking out strong resistance create a buy zone.
- Then, the price did a Double top and broke down a minor higher low:
- All-time high.
- Major Lower High.
- Minor Higher Low (June 2021 Low) is a Breakout Point.
- Thereafter, the price created a wedge bottom and bull flag that couldn’t break support, did not reach the Major Higher Low, and ended reversing up:
- 2022 Low.
- Minor Buy Zone.
- Finally, the price did a micro double top, now, after reversing up from a bear signal bar, is creating a micro double bottom.
Present: Market Cycle
2023 has a weak bull leg that reached resistance, then, the price has been trading sideways into a TTR (Tight Trading Range). A TTR is a BOM (Breakout Mode) pattern.
Traders want a swing out of the BOM; Bulls think that this is a Bull Flag and that the price will continue up until entering the sell zone or the Major Lower High. Bears thing that since the price couldn’t hold above the resistance (Breakout Point-June 2021 Low), the price will reverse down and test the 2022 Low.
Future: Inertia
Both, bull’s and bear’s thesis are good, which means that Traders are confused, and increases the chance that the first breakout up or down will probably fail. There is a 50% chance of failing, but remember that we are within the middle of a tight bear channel that occurred during 2022, and hence, there is more equilibrium around this zone than at an extreme.
Trading
After the failed bear follow through bar, I would wait for a Breakout of the TTR that fails, and play the failed BOM.
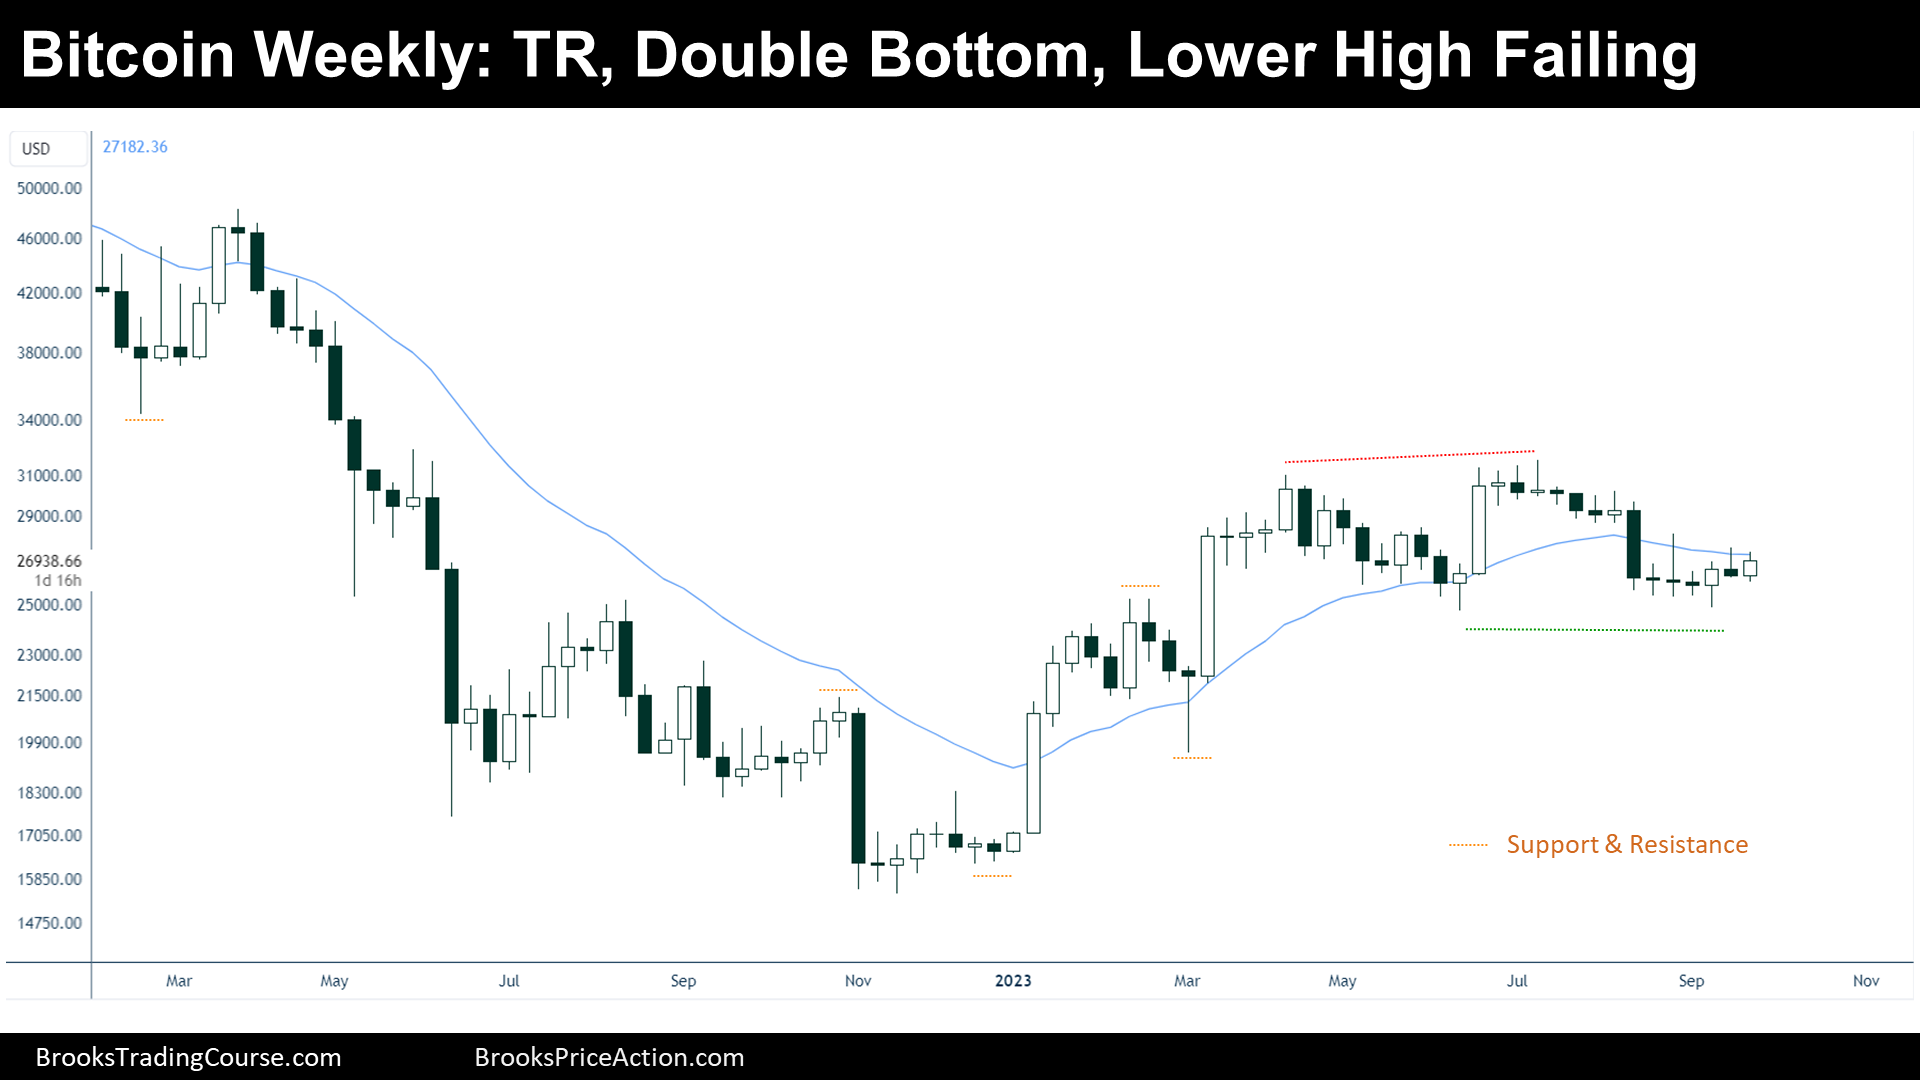
The logarithmic Weekly chart of Bitcoin

Past: Support and Resistances
- The price started a Strong Bear Channel:
- Bear Flag’s Breakout Point.
- Major Lower High.
- Then, failed a Breakout Below a Bear Flag and Reversed up, forming a HSB (Head and Shoulder Bottom) pattern, that broke up:
- 2022 Low.
- 2022s Major Higher Low.
- 2023 Major Higher Low.
- HSB Breakout Point
- Lately, the price has been sideways creating a Double Top and a Double Bottom, which is a Trading Range, a small Trading Range (not Tight Trading Range).
- Trading Range High.
- Trading Range Low.
Present: Market Cycle
Trading Ranges tend to break when they are exhausted if they are wide, and with a strong Breakout, when they are small like this one.
Future: Inertia
At some point, there will be a series of consecutive bull bars, or consecutive bear bars, that will form a strong swing.
Based upon what I have said on the Monthly Chart, this first swing up or down will likely fail.
Trading
Traders want a swing up or down, and will probably wait for a couple of strong consecutive bars, one side or the other, before Trading.
Market analysis reports archive
You can access all the weekend reports on the Market Analysis page.
Hi Josep, this is a very detailed post and thank you. Can you explain the use of log charts (why and what you’re looking for). Yes we are in a TR with current target 32k. I favour a breakout to the upside and I think we’ll see price grind higher over time but within trading ranges if that makes sense
Dear Tom C, thank you for your reading, insights and the interesting question.
Log charts and semi-log charts are helpful when evaluating the context of long-term charts. However, since Bitcoin is still pretty volatile, it even helps with nearer term charts, like the weekly one.
For example, the importance of the 2017-2020 trading range or Triangle is more understandable (and the 2022’s test of its breakout point). Moreover, the 2022’s bear trend looks climatic on the linear chart, but on the log chart looks sustained; hence, I do not expect too much potential of a reversal up after a sustained bear trend as I could expect from a climatic move.
Please do not hesitate to ask more about the topic.
Have a great week!, Josep