Market Overview: Bitcoin Futures
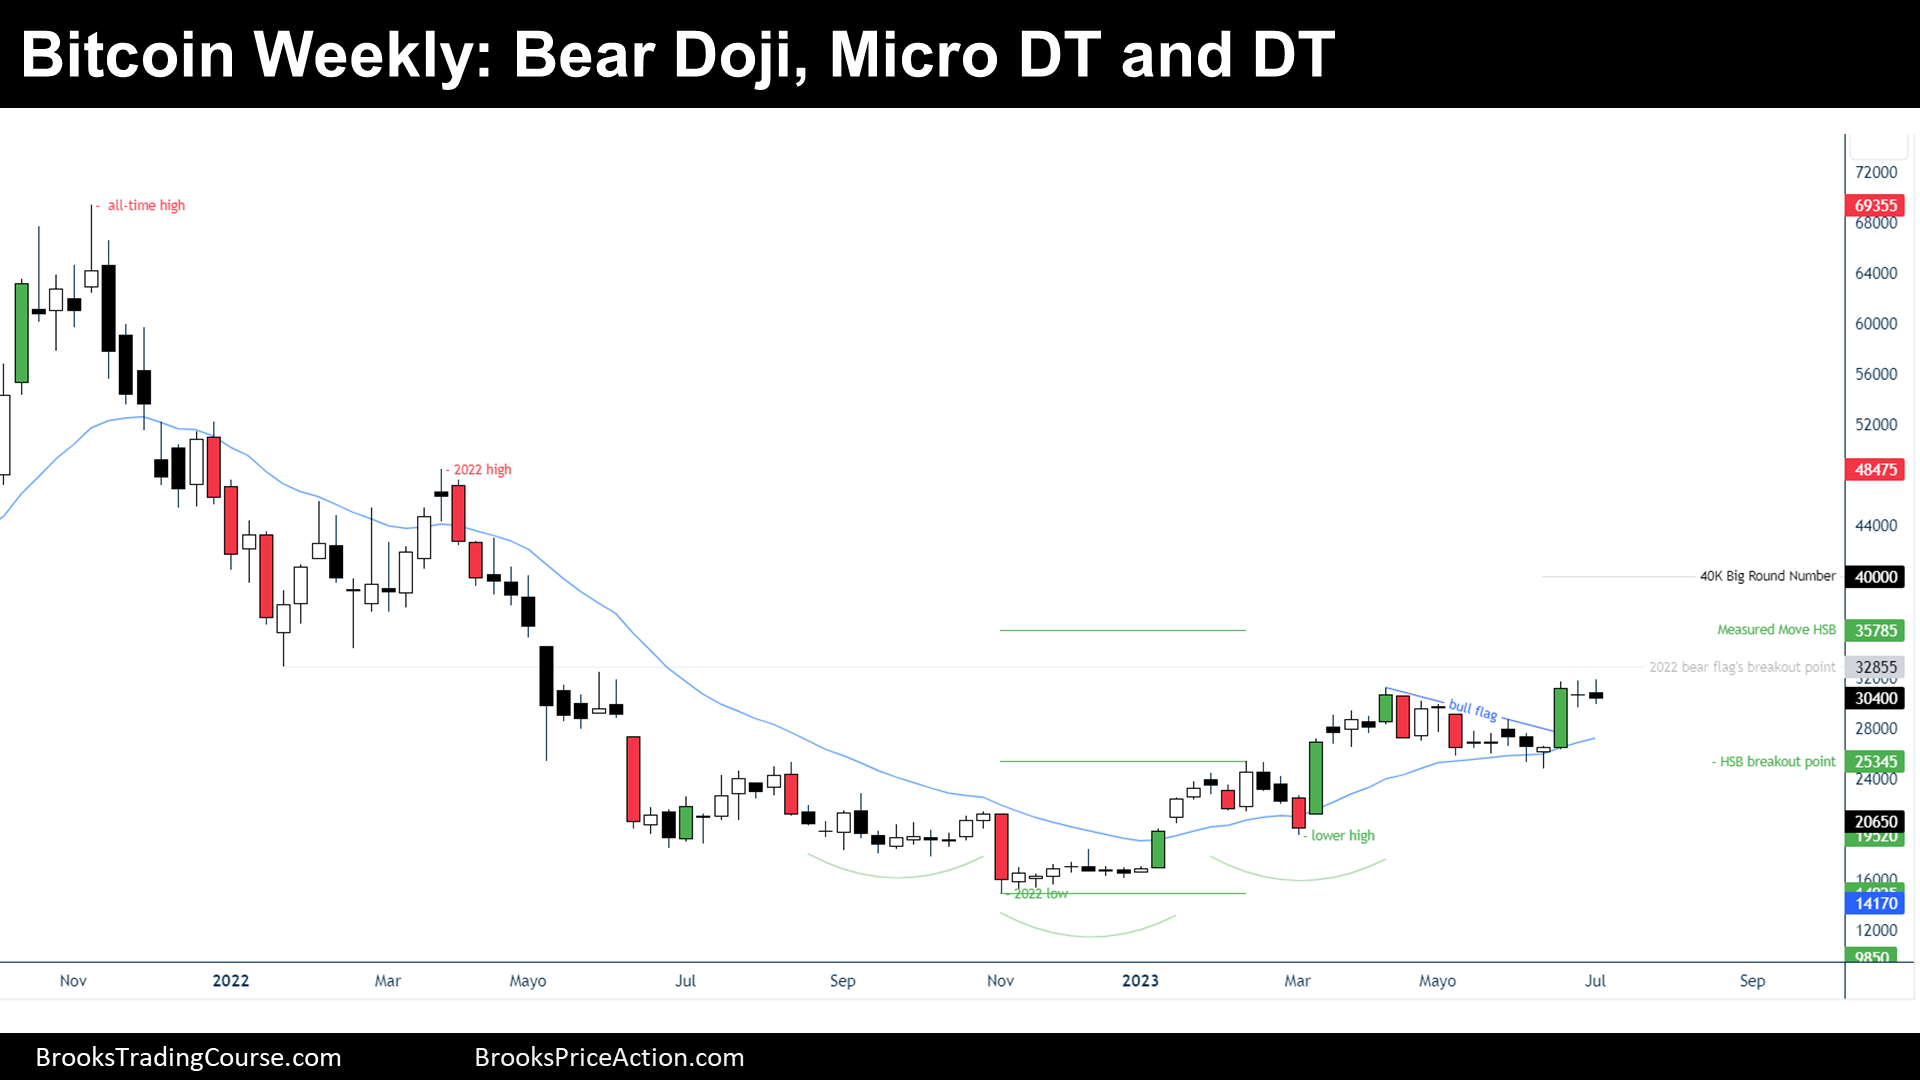
Bitcoin Futures July 2023 Double Top in Bull Channel. During the week, the value of a Bitcoin decreased 0.86%. A couple of weeks ago, a bull signal was triggered, but the follow through was not good since it was a doji bar closing below the bull signal close. This week was a bear doji that created a micro double top pattern within a major double top. This is not what bulls were hoping for, still, bears did not close the gap between the price and the bull’s flag breakout point around $27000. Until this gap is not closed, traders should expect buyers below prior bars and sideways to up trading.
Bitcoin futures
The Weekly chart of Bitcoin futures

Analysis
- This week’s candlestick is a bear doji bar. This bar forms a micro double top and a major double top, contained within a bull channel.
- A couple of weeks ago, there was a bull breakout of a bull flag and a bull signal. The price was coming from closing the gap of a head and shoulders bottom (HSB) breakout point, a negative gap since there was not any close below the breakout point. That was good for the bulls.
- However, the bull signal stalled at the resistance of a 50% retracement of 2022’s bear trend around $31650 (not shown in the chart).
- Bulls:
- Want to reach a Measured Move (MM) based upon the size of the HSB.
- Ultimately, they want the bull channel to continue up towards the 2022 high.
- Bears:
- Want a double top at the 50% retracement.
- They need closes below the bull flag’s breakout point, the May 30th high.
- Moreover, they want a full reversal of the bull signal triggered a couple of weeks ago. If that happens, the next stop might be the higher low.
Trading
- Swing Bulls:
- This week’s candlestick is not a good bull signal bar.
- Bulls that bought the bull signal a couple of weeks ago might exit their trade below a bear bar.
- Most should trust their stop at the higher low and see what happens when bearish gaps are closed.
- Swing Bears:
- This week’s candlestick might be an ok signal bar; however, the context is not good for the bears, since the market cycle favor bulls: higher lows and higher highs.
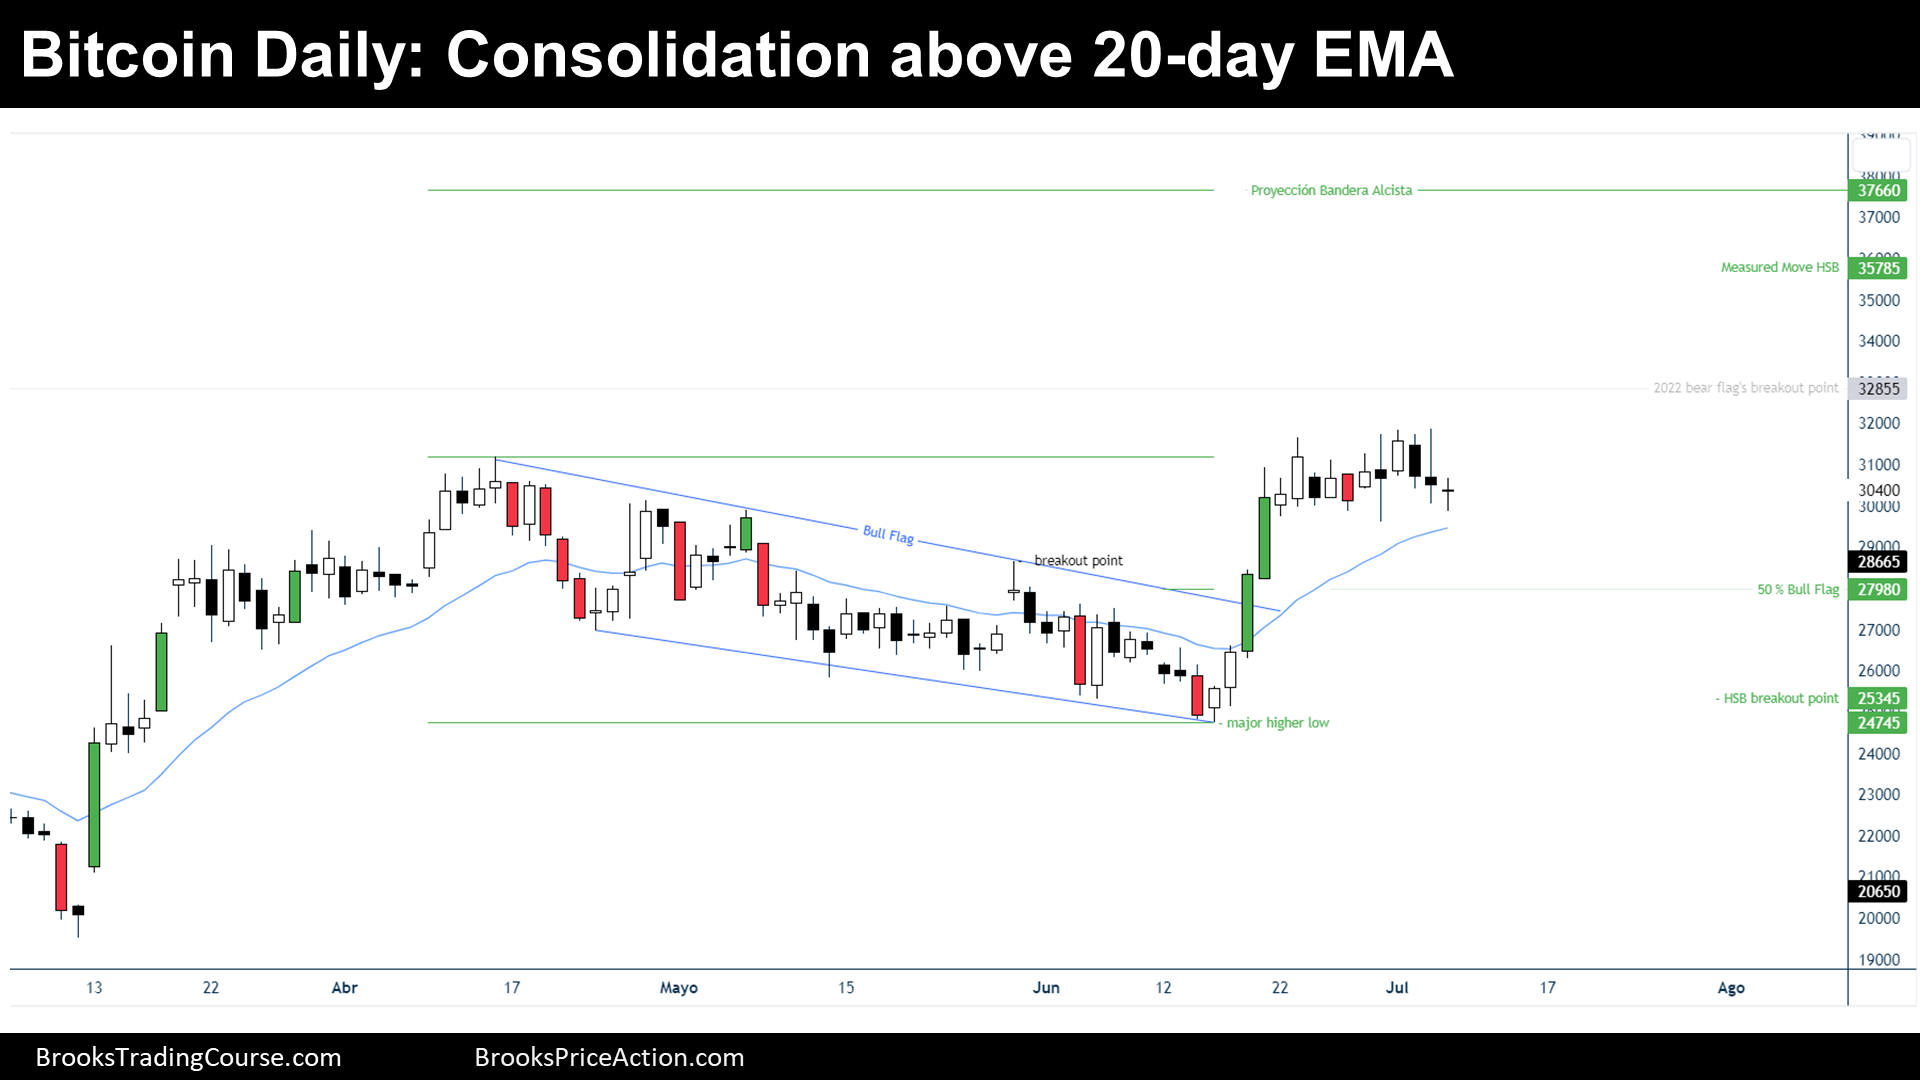
The Daily chart of Bitcoin futures

Analysis
- During the week, the price traded mostly sideways. It reached a new 2023 high and then reversed down.
- The price was coming from breaking up a bull channel. The bull breakout was fair and strong; hence, if there is a reversal down, it will probably be bought. More likely, another leg up will emerge soon.
- Bulls:
- After a bull breakout, a bull channel is expected. This is what bulls want, a spike and channel bull trend.
- They do not want closes below the breakout point.
- Bears:
- They want bear closes below the breakout point.
- They hope that the price is within a trading range market cycle instead than a within bull channel.
- Ultimately, they want a full reversal of the bull breakout.
- The price was sideways the past two weeks (10 days). The bulls still have the inertia in their favor.
Trading
- Swing Bulls:
- Some might buy at the 20 Exponential Moving Average. Others might buy a 50% retracement.
- The stop loss is the same for both trades: below the major higher low.
- Swing Bears:
- They need a bear breakout, or a lower high and low.
- Want to see that bears that sell above the 20 Exponential Moving Average are winning money.
Market analysis reports archive
You can access all weekend reports on the Market Analysis page.
Thank you so much for writing your analysis on this. Please keep them coming!
Appreciate very much your comment, Drew. Wishing you a great trading week ahead!
Josep.