Market Overview: Bitcoin Futures
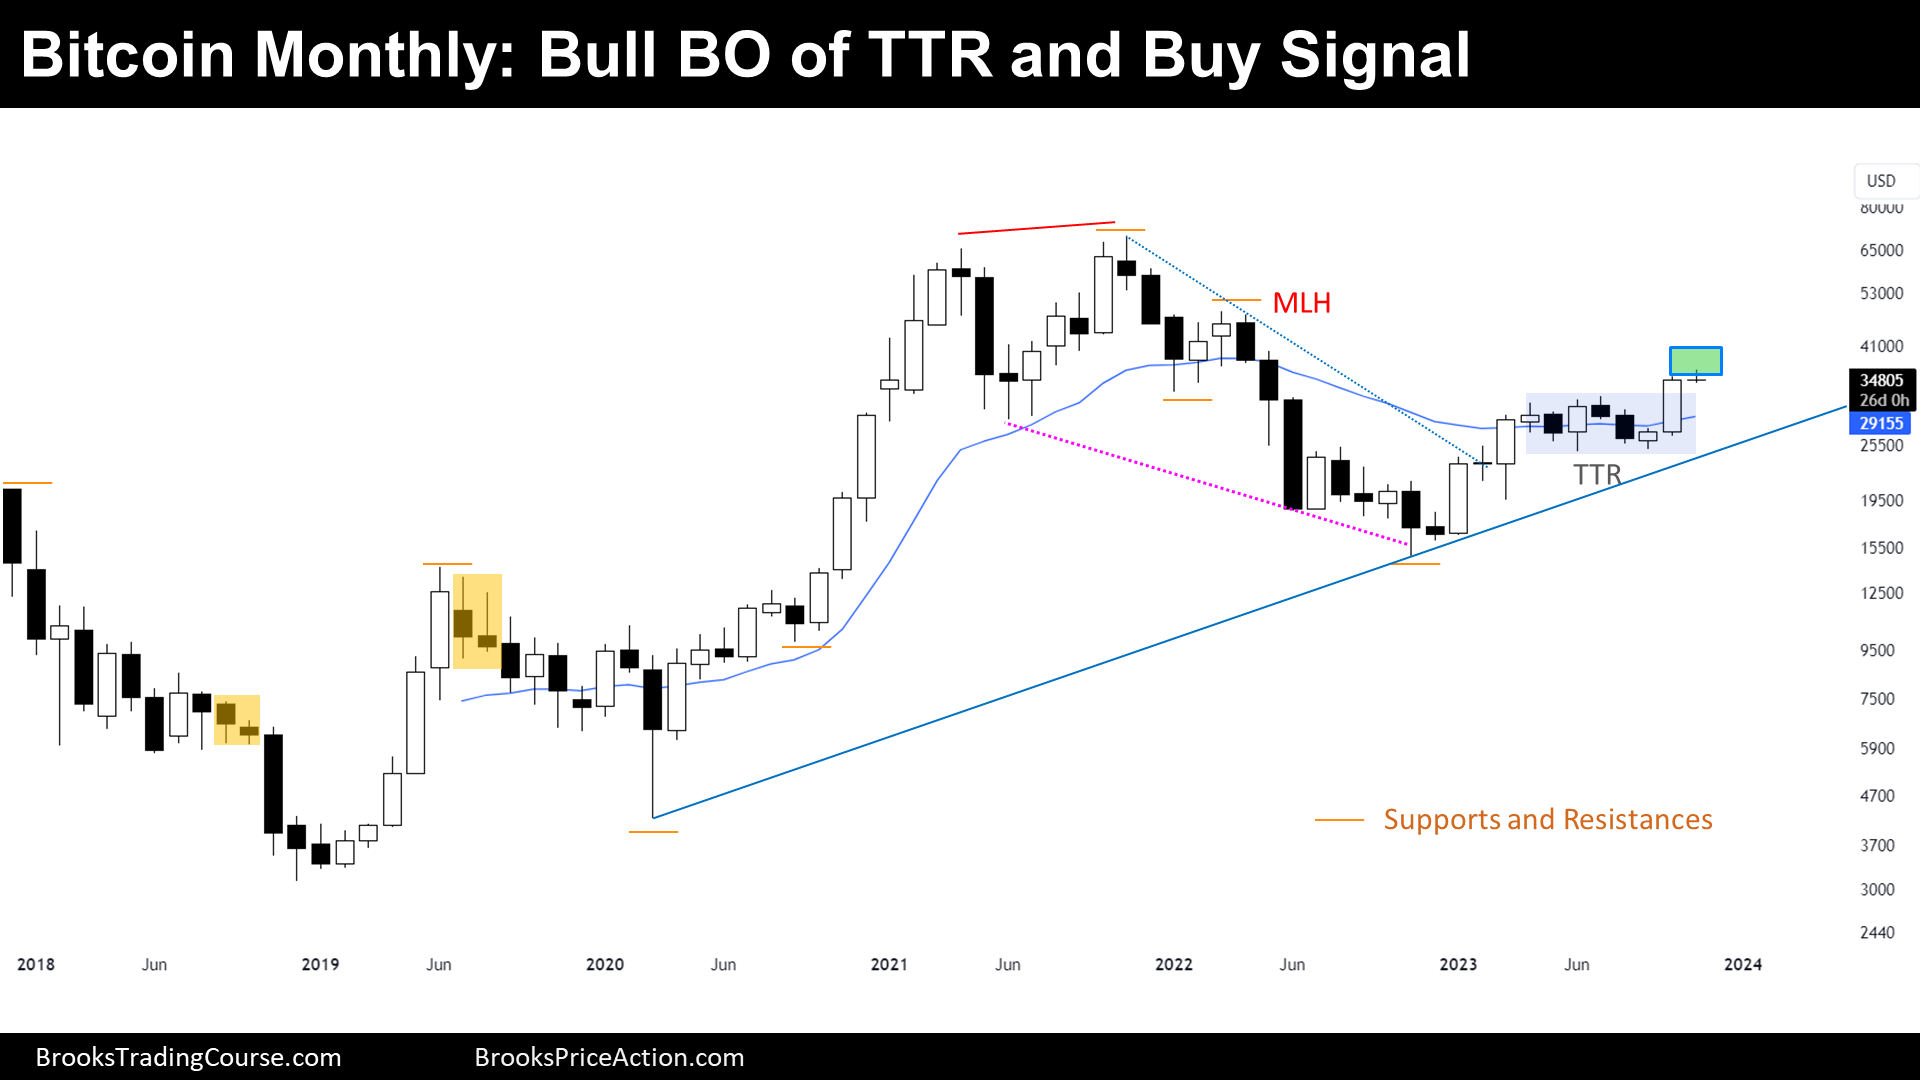
Bitcoin formed a severe bull bar in October. During October, the price increased its value by 28.80%. The price created a bull breakout bar that is breaking a breakout mode pattern. Looking to the left, there is some confusion, and Traders are waiting for confirmation during November.
Bitcoin futures
The Monthly log chart of Bitcoin futures

Past: Supports and Resistances
- Bitcoin did a strong bull breakout of a Trading Range that lasted from 2017 until 2020.
- 2017s high.
- 2019s high.
- Bull Breakout Low (Major Higher Low).
- Three consecutive Bull Breakout Bars breaking out strong resistance create a buy zone.
- Then, the price did a Double top and broke down a minor higher low:
- All-time high.
- Major Lower High.
- Minor Higher Low (June 2021 Low) is a Breakout Point.
- Thereafter, the price created a wedge bottom and bull flag that couldn’t break support, did not reach the Major Higher Low, and ended reversing up:
- 2022 Low.
- Finally, the price did a micro double top, and after reversing up from a bear signal bar, created a micro double bottom.
- Tight Trading Range (TTR), which is also a Breakout Mode Pattern (BOM)
Present: Market Cycle
- October is a severe Bull Breakout Bar.
- October achieved a fresh 2023 and closed near its high.
- Moreover, October closed above the high of the prior bars.
- But even if this looks bullish, Traders should remember that there is only a 50% chance that the first Breakout of a BOM is going to succeed.
- Furthermore, the market cycle is more likely a Trading Range than a Major Bull Trend Resumption.
- On the left of the chart, there is a Tight Bear Channel, which contain sell zones.
- Most bars during the Rally were followed by bad follow through.
Future: Inertia
- Bulls are in control, and they are going to try to get to next resistance at $40000 Big Round Number.
- November will be the follow through bar:
- Bulls want another bull bar closing around its high to increase the chances of a Major Bull Trend Continuation.
- Bears want a Bear Bar closing on its low, for a Failed Bull Breakout of a BOM.
- A bar with big tails on both ends will support the market cycle trading range thesis.
Trading
- Bulls:
- They are buying the BOM pattern.
- Their Stop Loss is below the BOM pattern or below September’s low. ‘
- Their Target is to get to the Major Lower High (MLH).
- Bears:
- They want a Bear Breakout Bar in November.
- Then, they will sell below, since that would be a Failed Bull Breakout of a BOM.
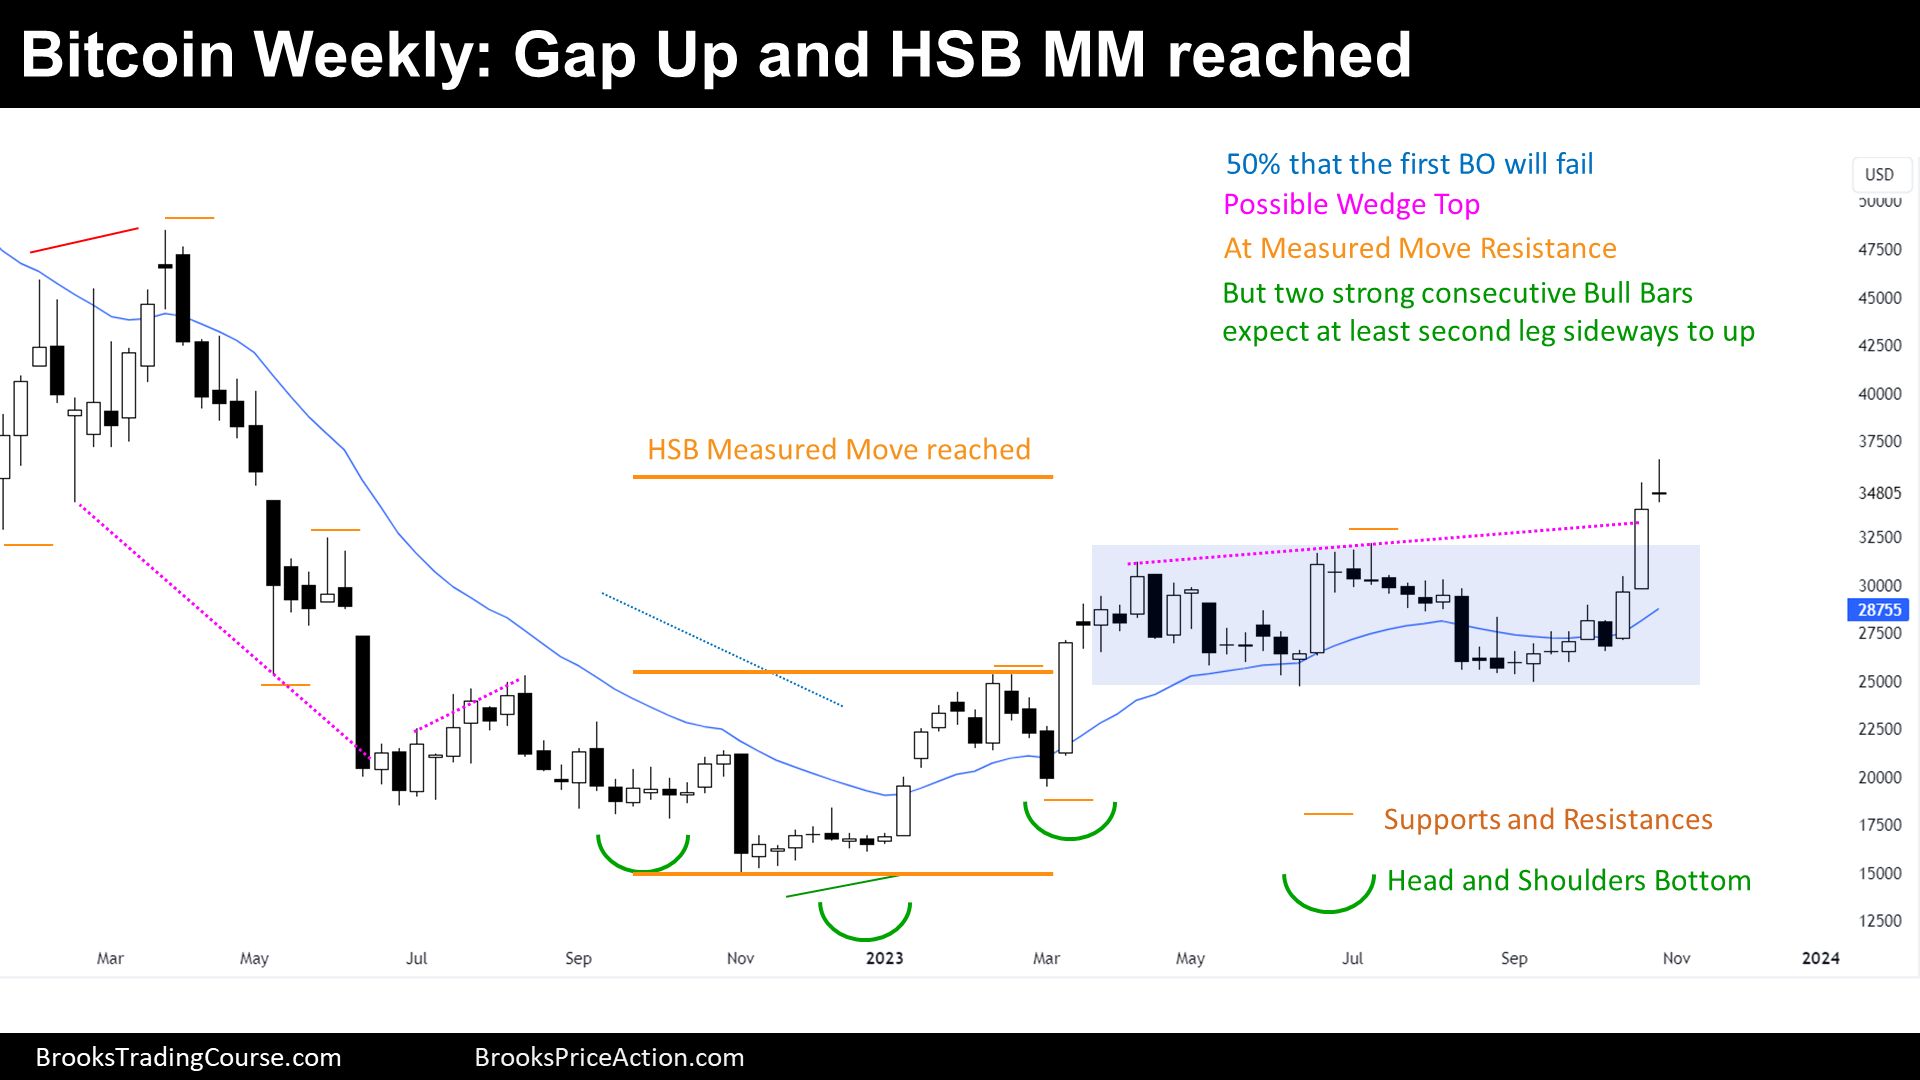
The Weekly chart of Bitcoin futures

Past: Support and Resistances
- The price started a Strong Bear Channel:
- Bear Flag’s Breakout Point.
- Major Lower High.
- Then, failed a Breakout Below a Bear Flag and Reversed up, forming a HSB (Head and Shoulder Bottom) pattern, that broke up:
- 2022 Low.
- 2022s Major Higher Low.
- 2023 Major Higher Low.
- HSB Breakout Point
- HSB Measured Move around $35750.
- Lately, the price has been sideways creating a Double Top and a Double Bottom, which is a Trading Range, and because the Trading Range is not wide, it is also a Breakout Mode Pattern.
- Trading Range High.
- Trading Range Low.
Present: Market Cycle
- The price reached the HSB Measured Move during the week.
- There was some profit taking, since the price reversed down slightly after reaching the Target.
- But after a strong leg up like this one, Traders should expect, at least, another leg sideways to up, even if this bull breakout is going to fail.
Future: Inertia
- A bull breakout of a Breakout Mode Pattern has a 50% chance of leading to a swing trade, which means that the price might go towards $47000.
- A bull breakout of a Breakout Mode Pattern has a 50% of failing and lead to a bear swing trade.
Trading
During the prior reports, we have said that bulls want a relatively strong bull breakout above the Breakout Mode Pattern high. This is not high enough to think that the bull breakout has a high probability of success (60% to 70%), however, until bulls are not proven wrong, Traders should look to the upside.
- Bulls:
- Some Bulls bought above the past week’s bull signal bar.
- Others, bought above the 2023 high.
- Some traders bought above the past week’s bull bar, which was the first bull bar that closed above the Breakout Mode Pattern.
Most bulls are placing their stops below the Breakout Mode Pattern, however, placing the stop loss below the past week’s low is also ok.
- Bears:
- They see a Wedge Top, and they think that there were trapped bulls at the prior resistances, where gaps were closed.
- But they would rather not sell while the price is rising, and they will either wait a bear signal bar for a failed bull breakout setup or just place a sell stop order below the Breakout Mode Pattern.
Market analysis reports archive
You can access all the weekend reports on the Market Analysis page.