Market Overview: Weekend Market Analysis
The SP500 Emini futures market has been in a strong bull trend for a year. The recent streak of 13 consecutive bull bars increases the chance of at least a 10% pullback lasting a couple months coming this summer. This week is a sell signal bar on the weekly chart (5 bears bars on daily chart). If next week sells off, then traders will begin to think that a 10% correction is underway.
The EURUSD Forex chart formed a big bull bar in April, but it is near the top of a 7-year trading range. While the market might rally more in May, it will probably stay within the range for at least a couple more months.
EURUSD Forex market
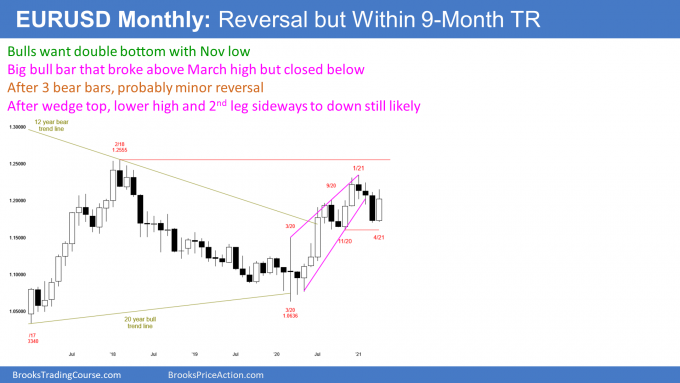
The EURUSD monthly chart

- March was a big bear bar on the monthly chart.
- I will show the weekly chart next week, and I show the daily chart in my daily blogs. Today was a big Bear Surprise Bar on the daily chart, which increases the chance of lower prices next week.
- On the monthly chart, April was a big bull bar that totally reversed March.
- April broke above the March high, but closed just below the March high.
- The bulls see April as a reversal up from a double bottom bull flag with the November low.
- They want the 3-month selloff to be just a pullback, from the 2020 rally up from the March 2020 higher low major trend reversal.
- The bears want a lower high and a 2nd leg down from last year’s wedge rally. That is still more likely than a bull trend.
Trading range for 7 years
- The monthly chart has been in a trading range for 7 years (since February 2015, but the chart above only shows 4 years).
- Trading ranges regularly disappoint bulls and bears. The close below the March high is disappointing to the bulls, which is a reminder that the yearlong rally has not yet broken out of the 7-year trading range.
- Every trading range always has both a reasonable buy, and a reasonable sell setup. The bulls have a double bottom bull flag with the November low. The bears have last year’s wedge top and they want a 2nd leg down.
- The probability of the direction of the breakout never gets much above 50%. When there is a big bear bar or two, the odds go up slightly for the bears. When there is a strong bull bar, like in April, the odds go up slightly for the bulls.
- Trading ranges resist change. Until there is a breakout there is no breakout.
- Until there is a breakout up or down, a strong leg up or down is more likely to reverse, than grow into a trend.
- While April is bullish, as was last year, the bulls need a couple closes above the February 2018 high before traders will look at this rally on the monthly chart as a bull trend.
- The bears see the January high as forming a double top with the 2018 high. They hope April is just another test of the top of the 7-year trading range.
- The bears need a strong sell signal bar this summer before traders will look for a swing down.
What to expect in May
- I said that the monthly chart is near the top of its 7-year trading range. It has also been in a small trading range for 9 months.
- With April being a big bull bar, traders might expect May to trade at least a little higher. But, it probably will not break out of the 7-year range. In fact, the odds are against it closing above the January high.
- There will probably be a month or two down, starting within the next couple months.
- Traders should expect the 9-month range to continue for at least a couple more months.
- There is only a 30% chance that May will be a 2nd consecutive big bull bar closing near its high.
- When a chart is not clearly bullish or bearish, it is in a trading range. Traders know that a reversal every few months is more likely than a move growing into a trend.
S&P500 Emini futures
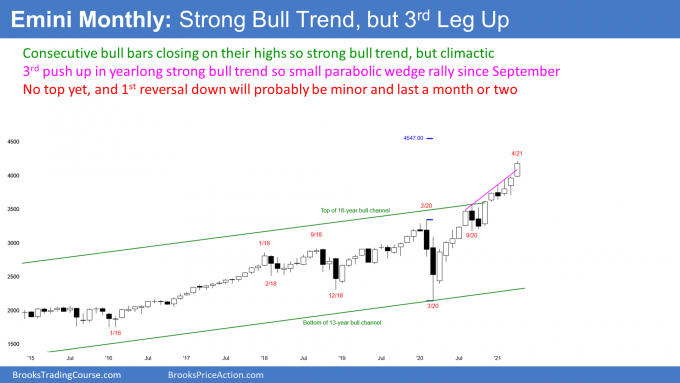
The Monthly Emini chart

- Consecutive big bull bars closing near their highs.
- Normally, next month should trade at least a little higher. But because of weekly and daily charts (see below), May might not continue up.
- Every low for 7 bars (months) has been above the low of the prior month.
- This is an 8-bar bull micro channel and it is a sign of aggressive buying. Traders will buy the 1st 1- to 2-month pullback.
- It is also unsustainable. That means it is a buy climax. A buy climax typically attracts profit takers.
- There are 3 legs up since the September low. That is a parabolic wedge buy climax, and it often attracts profit takers.
- Buy climax can continue far longer than what might seem reasonable. However, the acceleration up over the past two months increases the chance of some profit taking soon.
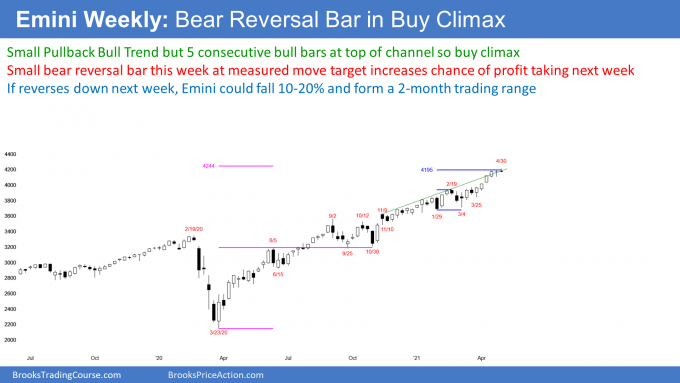
The Weekly S&P500 Emini futures chart

- Bear reversal bar after 5 consecutive bull bars. This week is a sell signal bar for next week.
- There have not been more than 5 consecutive bull bars in the yearlong bull trend, so this is an extreme buy climax. This increases the chance of profit taking soon.
- Stop for many bulls is below the March 4 low, which is far below.
- Easiest way to reduce risk is to reduce position size by taking some profits.
- Once enough bulls start to take profits, there will be a 2- to 3-week selloff.
- Yearlong rally has been a Small Pullback Bull Trend, which usually does not last much longer than 50 to 60 bars.
- Current rally has lasted more than 50 bars, so increased chance of it transitioning into a trading range for a couple months.
- Small Pullback Bull Trend is a very strong bull trend. Traders want to buy the 1st 10% pullback.
- It usually does not reverse into a bear trend. It typically evolves into a trading range. Once there is a trading range, the bears would then have a 40% chance of a trend reversal down.
- Because the buy climax is extreme, many bulls will not look to buy again until after a 2nd leg sideways to down, like September and October last year.
- Therefore, while the initial selloff might only be 3 weeks, the Emini might go sideways for a couple months.
- Since bull trend has been accelerating up for 2 months, increased chance that this is a blow-off top.
- That typically leads to a deeper and longer pullback. Therefore, once there is a pullback, it could be more significant than in September and October 2020. There is a 30% chance it could be 20% and last several months.
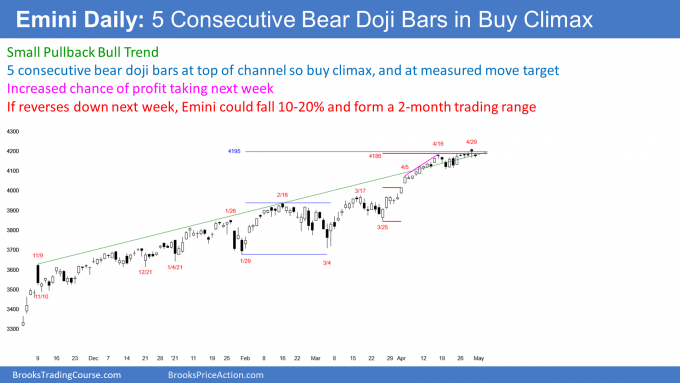
The Daily S&P500 Emini futures chart

- Strong Small Pullback Bull Trend since March 25.
- Markets resist chance. While there is an extreme buy climax, the odds always favor higher prices until there is a strong reversal down. By the time traders conclude that a correction is underway, it is usually already about half over.
- This week had 5 bear bars (consecutive doji bars). This is very unusual and it increases the chance of a reversal down next week.
- 9 of the last 11 bars had small bodies or big big bear bodies. This represents early profit taking, and it increases the chance of a bigger pullback beginning soon.
- Most important chart pattern for the bears is the streak of 13 consecutive bull bars, which ended April 16.
- That is the most extreme streak in 10 years. The last similar streak was 15 bars back in February 2011. It led to an immediate 9% selloff. After a brief new high, there was a 24% correction.
- The point is that an extreme streak often leads to a correction that is bigger, and lasts longer than recent pullbacks. Therefore, once there is a reversal down, it will probably be at least as big as the 10% from September and October 2020, and it might last longer.
- If there is a 20% correction, there might not be another new high this year.
- I mentioned in the trading room on Wednesday just after the open that I shorted and plan to scale in 50 to 100 points higher.
- Picking the exact top in a strong bull trend is a low probability task. The odds always continue to favor at least slightly higher prices when the Emini is in a strong bull trend. However, It is currently more likely that the next 10% move will be down than up.
- March and April are the most bullish consecutive months of the year. They were very strong this year.
- That probably increases the chance of the next seasonal tendency, which is a pullback in May and June. A common trading adage is “Sell in May and go away.”
- Do not place trades based on calendar patterns. They are not reliable enough, and there are many other far better setups to trade.
- Bottom line… streak of 13 bull bars, 2 weeks of weak bars, and 5 consecutive bear dojis increase the chance of a 10% pullback beginning in May. If there is a strong reversal down next week, it would probably be the start of a 10%, 2-month correction.
Trading Room
Traders can see the end of the day bar-by-bar price action report by signing up for free at BrooksPriceAction.com. I talk about the detailed Emini price action real-time throughout the day in the BrooksPriceAction.com trading room. We offer a 2 day free trial.
Charts use Pacific Time
When I mention time, it is USA Pacific Time (the Emini day session opens at 6:30 am PT, and closes at 1:15 pm PT). You can read background information on the intraday market reports on the Market Update page.
Al, if this could be a blow off top and a parabolic wedge in a spike and channel trend from the pandemic lows and looks like we are 5 bars above the top of the 11 year bull channel, what do you think about the possibility of going back to the bottom of the channel.
I have talked about this a few times. The Emini should retrace the channels on all time frames at some point. Currently, that includes the monthly chart as well.
There is a 40 to 50% correction every decade or so. There are 70% corrections every several decades. That means if the Emini continues up to 6,000 without more than a 20% correction, the chance of it falling back to 2,000 to 2,500 would be less than 10%. The higher it goes, the less likely the lower targets will ever be reached.
Option traders see something coming. The S&P 500 has gone sideways for that last two weeks yet the expected move was larger last week and increased even more for this coming week.
The market is deciding between a run to 4,500 and a 10- 20% selloff. Since a summer selloff is slightly more likely, if it goes up, it could go up far and fast as the bears cover.
I always look forward to reading your insights, thank you for sharing. I also think the market will likely have a correction and think it would make sense for the market to test 4100 and 4000 from above at minimum. Looking back at the past 20 years of daily charts (globex) the market has historically rotated around large century figures rather than blowing right through them and never looking back.
When the market broke 2000 in September 2014, it rotated in a large trading range between approximately 1800 and 2130 until successfully breaking out in late November/early December of 2016. The break through 3000 formed a trading range between July 2019 and October 2019 spanning between approximately 2728 and 3029 then broke out to the upside. The market violently crashed through 3000 in the early part of 2020. The round thousand number of 4000 will likely be tested from above as well but probably not as violently as the crash in 2020 since there is less fear and uncertainty surrounding COVID-19. This range may be more similar to the rotations that occurred around 2000 and 3000, forming a range that is 250-500 points or so.
The breakout through 2300 in February 2017 was the only century figure that had very weak retest from above in the months after the BO occurred. The deepest pullback after that break came down to 2316.75, not reaching 2300, from a high of 2947 in December of 2018. It wasn’t until the 2020 crash that the market finally fell below 2300 (all the way to 2260) before reversing up aggressively. Based on the fact that the market has retested every century figure from above for the past 20 years, I believe the 4000 and 4100 will be tested at the very least. There is a small possibility that the market will treat 4000 or 4100 in the way that it treated 2300, essentially a shift in the perception of value keeping the market above that level for a relatively long period of time (took 3 years to break 2300), but I think the probability of that is small.
Additionally, treasury note and bond futures (looked at ZF, ZN, and ZB) have been slightly rising since late March/early April which may be a sign of capital reallocation from more risk on to risk off instruments. All three instruments are making higher highs and higher lows, however it still looks more like a bull leg in a trading range. Correlations and inverse correlations don’t always hold up though so this may be less of a factor, but it does potentially lend support to a bearish thesis in the indices.
Question about trade management: When you’re holding a position for a longer period of time and willing to scale in 50-100 points higher, do you ever hedge using other instruments? For example, if you have a core ES short position and the market rises, would you consider hedging using the NQ or some other highly correlated instrument?
I do not put on a hedge at the moment I put on the short, but when I put on a short in a bull market, it can be a hedge against other long positions.
I would never hedge in a highly correlated instrument because it would totally erase the short.
There are many ways to go short. I sometimes simply short the Emini, and other times I use derivatives, like puts or inverse ETFs. Some even think of shorting a major stock like AAPL as going short the stock market. This is because it is such a big part of the market and many other companies are dependent on it that it is highly correlated with the market.
Thanks Dr. Brooks! The reason I brought up using a highly correlated instrument is so that a longer term short can intentionally be erased temporarily rather than stopping out of the position or caring too much about the drawdown. So if the plan is to use a very wide stop and scale into a short position 50-100 points above, buying a highly correlated instrument so that the open loss from the short is offset by the profit from the long position. Then once the market reaches the area where the scale in position on the short is taken, if doing so is still valid, the long hedge position would be exited with a profit and the scale in position would be added. As you frequently talk about, if the market returns to the first short entry then the scale in portion of the short would result in a profit as well.
I’ll spend some time today reading through the chapters in your textbooks on options and inverse ETFs because those are two areas of focus where my understanding still needs to be built up further. Hedging is something that is relatively new to me as well. My curiosity was piqued from reading a book on spread trading by Keith Schap to expand my understanding of how different traders approach the market, though I only put on directional trades rather than relative value trades. Since spreads are somewhere between trading outright positions and applying a hedge, I became curious to learn more about hedging as well. I appreciate your perspectives.
If you’re hedging long positions in a bull market, would you prefer to use something like SPY or futures options rather than the ES so that you can continue to day trade the ES or using different accounts to do it? Do you have any recommendations on books or other resources to expand my understanding of portfolio management and/or hedging? Thank you!
Hi Al, like to ask about your pull back assumption of 10 to 20% on the S&P. Is this also based on the earlier breakout point back down to the beginning of your MM target? thank you
There are many magnets below, and I have discussed them over the past few weeks. However, the single biggest reason is that most years have at least one 10% correction, and traders expect it. If the market falls a few percent lower, they then expect 20%.
This is in part because of standard market definitions that all traders know. A “correction” is 10% and a “bear market” is 20%. They both are important psychological magnets.