Trading Update: Tuesday May 31, 2022
Emini pre-open market analysis
Emini daily chart
- The market closed above the 9-month trading range low last Friday, creating a failed bear breakout. The odds are the market will test the middle of the 9-month trading range sometime soon.
- The bulls got a strong bull breakout above the 20-period moving average and have four consecutive bull bars on the daily chart. This is strong enough to make the market always in long.
- The May 27 bull breakout closed far above the May 16th neckline of the double bottom (Math 12 and May 20). The bulls may get a measured move of the double bottom projecting up to around 4,328.
- The bulls also have a possible measured move projection of the May 25 – May 27 bull breakout that projects up to 4,387.
- The bulls want to close the April 18 breakout point, which will probably happen since the market is likely in a trading range.
- The bulls want the rally from the May 20 low to be the start of a bull rally that will test the all-time high. While the bulls have a chance at that, they need more buying pressure.
- The market is in a trading range, so it is possible the bulls just get a second leg up, and the market forms a lower high below March 29 or April 21.
- Even if the bulls get a deep rally, the bulls will try for another lower high major trend reversal and turn the market back down.
Emini 5-minute chart and what to expect today
- Emini is down 28 points in the overnight Globex session.
- The Globex market has been in a broad bear channel during the overnight session. This increases the odds of a rally on the open and the Globex market forming a trading range.
- The market will gap down on the open, which increases the odds of a trading range and the market going sideways and testing the moving average before the market decides on a breakout up or down.
- As always, most traders should wait for a credible stop entry such as a double bottom/top, wedge bottom/top, or a strong breakout with follow through.
- Traders can also consider waiting for 6-12 bars before taking a trade if they have trouble trading the open.
Friday’s Emini setups

Al created the SP500 Emini charts.
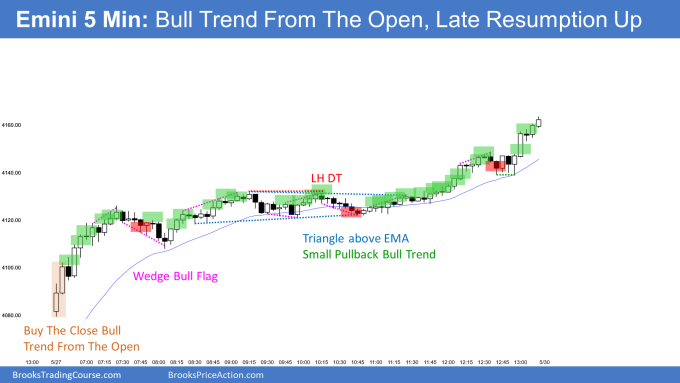
Here are several reasonable stop entry setups from last Friday (before market holiday long weekend). I show each buy entry with a green rectangle and each sell entry with a red rectangle. Buyers of both the Brooks Trading Course and Encyclopedia of Chart Patterns have access to a much more detailed explanation of the swing trades for each day (see Online Course/BTC Daily Setups).
My goal with these charts is to present an Always In perspective. If a trader was trying to be Always In or nearly Always In a position all day, and he was not currently in the market, these entries would be logical times for him to enter. These therefore are swing entries.
It is important to understand that most swing setups do not lead to swing trades. As soon as traders are disappointed, many exit. Those who exit prefer to get out with a small profit (scalp), but often have to exit with a small loss.
If the risk is too big for your account, you should wait for trades with less risk or trade an alternative market like the Micro Emini.
EURUSD Forex market trading strategies
EURUSD Forex daily chart

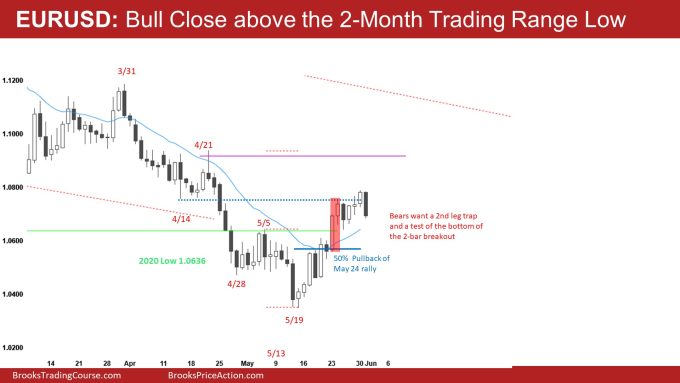
- The EURUSD found profit-taking back at the 2-month trading range low (April 14).
- The bulls managed to get a close above the trading range low, which is a sign of strength by the bulls.
- The reversal up is strong enough that any reversal down will likely be minor.
- The bears hope that they can form a lower high with April 21 and get a successful reversal back down.
- The market will likely reach the April 21 high after any pullback.
- Although the past two weeks have had a strong rally (see weekly chart for better visual), this is a trendline break of a bear channel, which means the market may get a deeper pullback than what the bulls want, creating a higher low major trend reversal.
- It is important to note that the market had weak follow-through after every strong bull breakout bar, which is a sign that the market may have a deep pullback.
- Overall, the bears will try to get a strong bear close today and follow through the next trading day. This would increase the odds of lower prices. The bulls want the opposite and for any pullback to be bought and prevent the bears from creating strong bear closes.
- Lastly, the bears want the May 23 -24 bear breakout to lead to a 2nd leg bear trap and a test of the May 23 low.
Summary of today’s S&P Emini futures price action and what to expect tomorrow
End of day summary

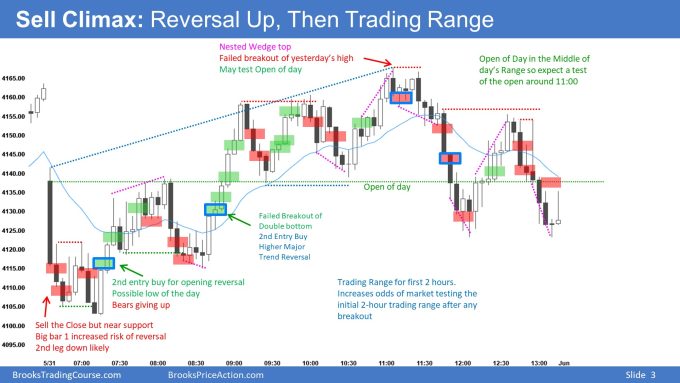
- Today, the market gap down and formed a sell climax followed by a reversal up, developing a trading range day.
- Bar 1 was a strong enough bear bar to make the market always, in short. However, it was a huge bar that made the risk/reward bad and increased the odds of a reversal.
- The three consecutive bear bars on the open were sell the close. However, it was close to Friday’s higher low (4,108) around 8:00 AM, which was an obvious support level. The market broke below Friday’s higher low on bar 3 and reversed up before the bears could make a scalp. This increased the odds of buyers below bar three and an opening reversal.
- The bulls got a second entry buy at 7:15 PT which was a credible swing buy for a possible low of the day.
- The rally up to 8:30 was strong enough of a minor reversal to lead to a possible high low major trend reversal which the bulls got around 8:45.
- The bulls got a strong buy the close rally up to 9:10. However, it was a possible 2nd leg trap, so the bulls took profits and waited to see how strong the bears were. The bears were unable to make the market always in short around 9:15, and the bulls bought again.
- The selloff from a high close during the 9:00 rally was likely to be tested during the 9:45 reversal up. The buy the close bulls were disappointed enough that they tried to take profits at the high close, leading to more sideways trading.
- The bears had a nest wedge around 11:10 PT that led to a test of the open of the day. The market is ocellated around the open of the day for the rest of the day.
- Another thing to point out is that when the market forms a trading range for two hours that is decent in size on the open (similar to today), there is an increased risk that any breakout up or down will eventually test back into the opening range. This is due to limit order traders scaling in confident that they can avoid a loss.
See the weekly update for a discussion of the price action on the weekly chart and for what to expect going into next week.
Trading Room
Traders can see the end of the day bar-by-bar price action report by signing up for free at BrooksPriceAction.com. Al talks about the detailed S&P Emini futures price action real-time throughout the day in the BrooksPriceAction.com on trading room days. We offer a 2 day free trial.
Charts use Pacific Time
When times are mentioned, it is USA Pacific Time. The Emini day session charts begin at 6:30 am PT and end at 1:15 pm PT which is 15 minutes after the NYSE closes. You can read background information on the market reports on the Market Update page.
Hi!
I felt confused in some parts of the day (31.05.22), below I will write some observations that I made during my trading period.
– I sold the close of bar 2 (stop at bar 1) but got out early at the close of bar 11, because after the market made the three big bear bars, and have formed L2 at bar 6 but even though find any more sellers.
– I bought above bar 14 for a scalp, assuming a variant of iOi, but exit after bar 16 almost took the order and formed a reversal bar with a double top, but I didn’t go short on it.
– I sold the close of bar 20, but left above bar 26, because for me the market formed the two-legged movement after breaking the wedge-shaped channel, leaving microgaps with the impulse of 3 bars (bars 9, 10 and 11 ) in addition to having been a double bottom with bar 12 and a double micro bottom with bar 18.
– Market correction after BTC from 26 to 31 reached 50% leg correction, but I didn’t feel comfortable to buy with limit order.
Obs: I dont speak english very well, so sorry if a wrote something confuse.
Thanks Brad for your contribuition.
Selling below bar 1 is a difficult trade because of the bad risk/reward. The risk is so big that the odds of getting 2x risk are not high. So the issue is that a trader selling below bar 1 has a bad risk-reward, which means they can only take the trade if they have a high probability (60% or greater). This means a trader has to know when to get out quickly when the probability lowers to below 60%. I did not like selling below bar 1 because the odds were one would not get 1x their initial risk.
This is classic trading range price action. The market is always trying to get you to buy too high and sell too low. For example, selling below bar 20 was reasonable, but a trader had to understand the risk of a higher low and a new high of the day. When a trader is selling below bar 20, they have to understand the context is bad (middle of a developing trading range). So if the context is bad, a trader needs the trade to go their way quickly. If it stalls as it did during bars 22-25, most traders will exit above bar 25 on the 2nd entry buy.
In general, trading ranges are difficult because think about doing the opposite of what seems reasonable. For example, Bar 1-3 is at the bottom of a possible high low from the previous day; wait for the second leg down and look to buy. Bar 20 is a big bear bar, but in the middle of the range, wait for a second leg down and look to buy a reversal.
Bar 35 is difficult because the bears needed one more strong bear bar closing below the moving average for the bears to make the market Always in short. Also, it was testing the 8:10 high. Traders were buying bear closes because their risk was small (they may exit if the bears got another strong bear bar closing below the midpoint on bar 36, and their reward was a new high of the day.)
I made a video over this day (see the link below) that might help clarify some of what I am talking about.
Video Link: https://youtu.be/eQT_G4eM6A4
I would highly suggest the Al’s Trading Room, though. It is a truly valuable tool because it gives you insight into how Al thinks bar-bar in real-time. The reason I say this is because the hard part about trading ranges is being neutral about the bull and bear case and being able to think through both sides.
https://www.brookspriceaction.com/portal.php?page=9
I hope all of this helps,
Brad