Trading Update: Thursday June 16, 2022
Emini pre-open market analysis
Emini daily chart
- The bulls got a reversal up yesterday; however, they probably need at least a micro double bottom which means the bears likely second leg down will follow.
- Market formed a bull bar yesterday, ending the streak of 5 consecutive bear bars on the daily chart.
- The bears want the second leg down to last many bars and reach 3,600, which is a measured move projection of the February to April trading range (double top).
- The next target is a measured move down based on the May to June trading range which projects down to 3,450.
- Lastly, the bears want a test of the pre-pandemic high.
- While the market may reach these projections, it will likely form a bottom soon and have to rally for at least a couple of months since the odds favor a trading range on the higher time frames.
Emini 5-minute chart and what to expect today
- Emini is down 78 points in the overnight Globex session.
- The Globex market had a strong selloff during the overnight session and has been going sideways for the past 4 hours.
- The day session will have a gap down and open around the lows of the past few days (support).
- The bulls and bears will both want a trend from the open; however, the day will likely have a trading range open (80% probability on most days).
- If the market does form a trend from the open, there is a 60% chance the day will form a trading range at some point and only a 20% chance the trend from the open will last all day.
- If a trader has trouble getting trapped in reversals on the open, they should consider waiting for 6-12 bars before placing a trade.
- Lastly, since the odds favor a trading range open, traders can wait for a stop entry such as a double bottom/top, wedge bottom/top, or a strong breakout with follow-through.
- Lastly, the bars are big, so traders must ensure they are trading an appropriate position size.
Yesterday’s Emini setups

Al created the SP500 Emini charts.
Here are several reasonable stop entry setups from yesterday. I show each buy entry with a green rectangle and each sell entry with a red rectangle. Buyers of both the Brooks Trading Course and Encyclopedia of Chart Patterns have access to a much more detailed explanation of the swing trades for each day (see Online Course/BTC Daily Setups).
My goal with these charts is to present an Always In perspective. If a trader was trying to be Always In or nearly Always In a position all day, and he was not currently in the market, these entries would be logical times for him to enter. These therefore are swing entries.
It is important to understand that most swing setups do not lead to swing trades. As soon as traders are disappointed, many exit. Those who exit prefer to get out with a small profit (scalp), but often have to exit with a small loss.
If the risk is too big for your account, you should wait for trades with less risk or trade an alternative market like the Micro Emini.
EURUSD Forex market trading strategies
EURUSD Forex daily chart

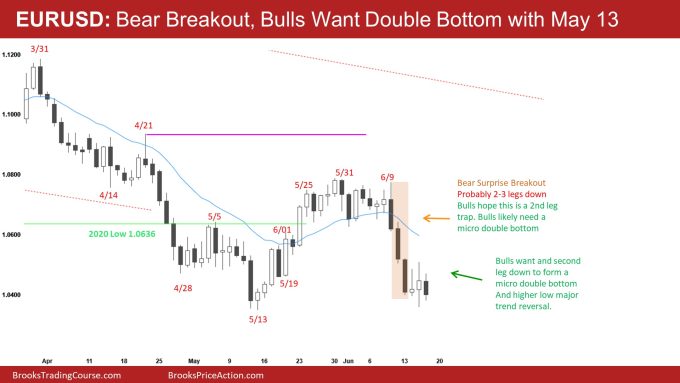
- The market got close to the May 13 low yesterday. The bulls want a double bottom with May 13 and a test back to the June high. The bears want a successful breakout below the May 13 low and a measured move down to around 1.000.
- At the moment, the odds are the market will have to reach the 2017 low, which is at 1.0339. This means the market will most likely fall below the May 13 low.
- While the market may get a successful breakout below the May 13 low and 2017 low, it is more likely that the bulls will form a bottom and stay within the 2-month trading range.
- The bears got a strong surprise three-bar breakout on June 13; however, it is within a trading range, which lowers the probability for the bears.
- The longer the market goes sideways following this bear breakout (June 13), the increased risk this bear breakout is a 2nd leg trap.
Summary of today’s S&P Emini futures price action and what to expect tomorrow

Al created the SP500 Emini charts.
End of day summary
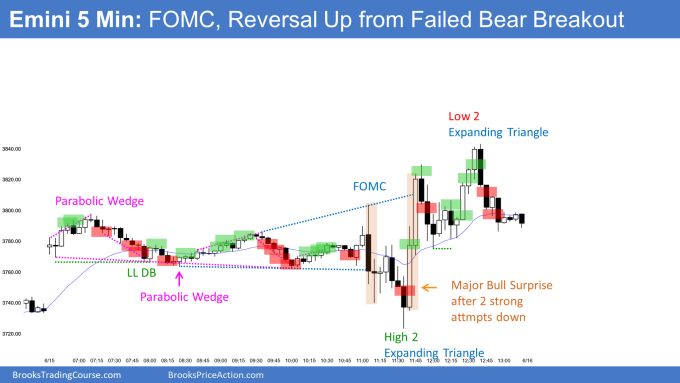
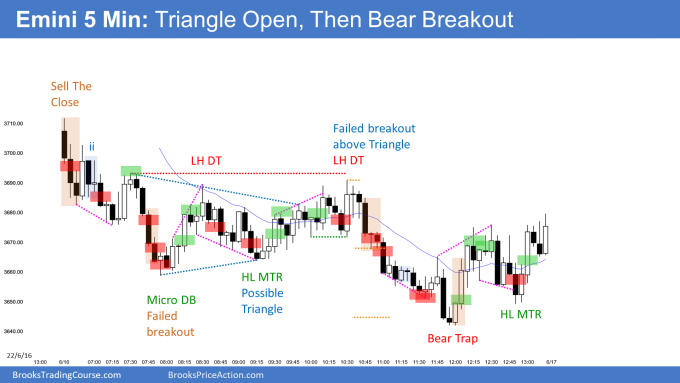
- Today gapped down and formed a triangle for the first half of the day, which led to trend resumption down.
- The market formed a trend from the open on bar 1. However, the leg down looked like a leg in a trading range, more than a bear trend.
- The bears got a bear breakout at 7:50 PT. However, the moving average was far away. The bears were not willing to sell this far away from the moving average, so bears took profits, and bulls started buying for a test of the moving average.
- By 9:40, the market was in a triangle, which is a breakout mode pattern. At this point, most traders should wait for a strong breakout up or down with follow-through.
- The bears got the bear breakout with follow-through around 11:00 PT. However, it was near the bottom of the range, so most traders would expect any selloff to be brief.
- Overall, today was a broad bear channel (basically a trading range). It is essential to understand that the bear channel mostly goes sideways and has occasional breakouts that are brief. This can be frustrating because, by the time a trader sees the breakout, there may be only a short second leg down before the market reverses.
- Also, trading ranges and channels often form the second leg traps, such as the 5-bar selloff down to 7:50. These breakouts often get a brief second leg down (can be one bar) and reverse up like they did today.
- Tomorrow is a Friday, so weekly support and resistance are important. So far, the weekly chart is a big bear trend bar. The bulls want to create as big of a tail as possible, and the bears want to keep the bar closing near its low.
- Tomorrow will likely have a bull close which will disappoint bulls on the weekly chart.
See the weekly update for a discussion of the price action on the weekly chart and for what to expect going into next week.
Trading Room
Traders can see the end of the day bar-by-bar price action report by signing up for free at BrooksPriceAction.com. Al talks about the detailed S&P Emini futures price action real-time throughout the day in the BrooksPriceAction.com on trading room days. We offer a 2 day free trial.
Charts use Pacific Time
When times are mentioned, it is USA Pacific Time. The Emini day session charts begin at 6:30 am PT and end at 1:15 pm PT which is 15 minutes after the NYSE closes. You can read background information on the market reports on the Market Update page.
Last sentence on the end of day summary appears cut off:
“Tomorrow will likely have a bull close which will disappoint bulls on the weekly chart. While it is possible the weekly chart continues down next week, the odds favor a…”
Thank you, Segar. I removed the sentence to avoid confusion.
Oh this is beautiful.
Well we WON’T talk about that any more will we.
That was alot of analysis to be COMPLETELY wrong.
I don’t mind being wrong. I AM the UTTER exception in this case.
The sheer audacity to think you know where the market is going is so laughable is borders on insanity.
You don’t need to know where the market is going to make money and to say you do is just delusional.
Obviously nobody can predict the future accurately all the time. It’s so obvious that it isn’t stated repeatedly. Instead you need to think in probabilities and risk. That’s why entries are important – again obviously there is a lot more to it than that.
You know all of this! But sometimes it’s helpful to go back to basics so thought I’d comment as a self refresher.
Question about Bar 1 being marked as a sell. Apart from it being a bear trend bar, is this a sell because of the significant gap-down from prior close? I waited on this bar thinking there was a chance bulls might reverse bar 2 so was wondering about this.
Hi Eric,
It’s a sell but not with the blue box, so it’s a setup for experienced trader. After big gap down far below EMA, you’re right that there was a chance that the next bar, bar 2, could possibly be a bull bar. If you took a sell below bar 1 and then bar 2 was a bull bar closing near its high, you had to exit above bar 2. Hope it helps.
Vorakan answered very well.
My two cents is you have to take all this with a grain of salt. No one knows whether the next trade will be a winner or not.
Really Al teaches buy above every bull bar in good context and sell below every bear bar in good context.
It’s kind ridiculous but if you look at his chart THAT’S ALL it is!!!!
They are only entries and don’t really mean anything anyway!!! Anybody can click a button to enter a trade.
These are all AFTER the fact and how to manage ANY of these real time is the real challenge.
Those are just boxes on a chart!!!
Again mark EVERY BULL bar a buy and EVER BEAR bar a sell then erase the one that don’t look good. Simple.
This sounds super negative but it’s NOT about entry!!!
It’s about KNOWING where to get out and how to manage yourself in between.
Sure trade the I don’t care size all ya want but not a single mention of how to manage through ANY of those entries. Not once.
Most people say, yes that’s easy. Just get out under a big opposite bar or 2 or 3 smaller ones.
Lol and that just brings me back to my point… That’s an absolute recipe for disaster!
Waiting only for 2X risk as if you somehow know for a fact that this setup leads to that edge would have to be taken EVERY single time. Otherwise you are trading discretionarily and how do you know when to get out of your trade? Move your stop to BE? Let it go with original stop? Take profits? Partial profits? (This makes NO SENSE to me) after a big bar or consecutive bars against you? This is NOW, NOT in the realm of ANYTHING Al really talks about except maybe the trader equation which is just simple mathematics.
None of this actually helps one trade.
What am I missing here?
It gives you structure. Sure so does Support and resistance. Copy almost any outstanding leg and you’ll find it MMs. The market just gyrates on many different frequencies (timeframes), simultaneously and constantly, always, looking to match buyers and sellers. Humans trade. We all see the highs and lows and if in the market our position in RELATION to the market…
…And that changes EVERYTHING!
Now what you do on a CONSISTENT basis WHILE in a trade will mean the difference between becoming a successful trader or not.
NOT finding entries!!!
Yet is anyone talking about managing positions or emotions or mistakes or regrets or the fact the WE DON’T KNOW WHERE THE MARKET IS GOING and NEITHER does ANYONE else!… Nope.