Market Overview: S&P 500 Emini Futures
The S&P 500 Emini futures stall at resistance and no follow-through above the 20-month EMA on the monthly chart. The bulls failed to get another follow-through bull bar. Bulls hope that this is simply a pullback and wants another leg sideways to up. The bears want a retest of the October low. They will need to create a follow-through bear bar in January to increase the odds of lower prices.
S&P500 Emini futures
The Monthly Emini chart

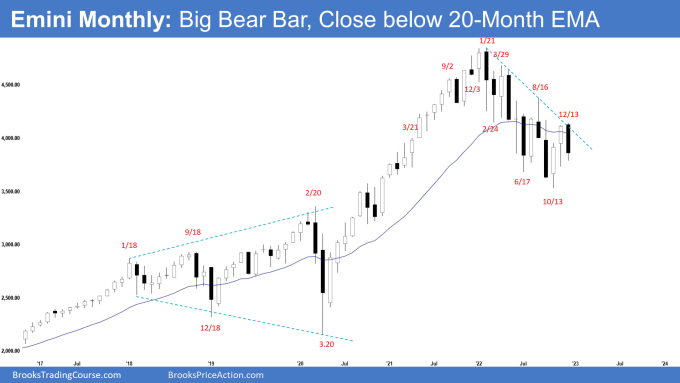
- The December monthly Emini candlestick was a big bear bar closing in the lower half with a prominent tail below, a stall at resistance.
- Previously, we said that the 2-legged sideways to up pullback may likely be underway.
- The bulls see the current selloff from January 2022 as a wedge bull flag (February 24, June 17 and October 13).
- They got a follow-through bull bar in November closing above the 20-month exponential moving average.
- However, the bulls were not able to create another follow-through bull bar and stalled around the major bear trend line.
- December traded slightly above November but reversed to close as a big bear bar below the 20-month exponential moving average.
- They hope to get at least a small second leg sideways to up following the current pullback.
- The 20-month exponential moving average and bear trend line are resistances above.
- The move down since January 2022 has a lot of overlapping bars. The bears are not yet as strong as they hope to be.
- They see the move down as a broad bear channel. They hope that the recent move up is simply forming a lower high and wants a retest of the October low.
- They then want a breakout followed by a measured move down to 3450 or the 3400 Big Round Number which is also year 2020 high.
- The bears will need to create a follow-through bear bar in January to increase the odds of lower prices.
- Because December was a bear bar closing in the lower half, it is a weak buy signal bar for January. It slightly increases the odds that the Emini may trade at least a little lower.
- The candlesticks in the last 7 months are overlapping between the range of 4300 and 3500 which means the Emini is in a trading range.
- Traders will BLSH (Buy Low, Sell High) until there is a breakout from either direction.
- Traders will see if the bulls can create a second leg sideways to up, or if the bears can create a follow-through bear bar in January.
- Until the bulls can break far above the bear trend line, the broad bear channel remains in play.
The Weekly S&P 500 Emini chart

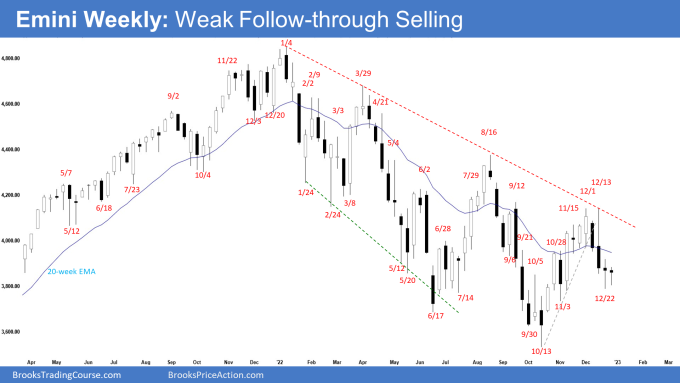
- This week’s Emini candlestick was an inside bear doji with a long tail below.
- Previously, we said that the odds slightly favor the Emini to trade at least a little lower.
- While the Emini has traded lower, the last 2 candlesticks were bear dojis with long tails below.
- The bears see the recent move up forming a wedge bear flag (Oct 5, Nov 15, and Dec 1), a double top bear flag (Sept 12) and a lower high.
- They got a reversal lower following the micro double top (Dec 1 and Dec 13).
- Bears see the selloff from January 2022 as a broad bear channel. The major bear trend line remains as resistance above.
- The bears got a big outside bear bar, but weak follow-through selling.
- They hope to get at least a small second leg sideways to down after a pullback (bounce).
- The problem with the bull’s case is that the selloff from August was very strong. The sideways to up leg may lead to a lower high. For now, this remains true.
- The bulls need to create strong consecutive bull bars closing near their highs breaking far above the major bear trend line to signal the end of the correction.
- They want a reversal from a higher low major trend reversal and a double bottom bull flag (Nov 3 and Dec 22).
- The bulls want a second leg sideways to up retesting December high.
- Since this week was an inside bear doji with a long tail below, the Emini is in breakout mode.
- Because of the weak follow-through selling, odds slightly favor the Emini to trade at least a little higher towards the 20-week exponential moving average.
- Traders will see if the bulls can create strong consecutive bull bars closing near their highs or if the Emini trades higher but reverses lower or as weak bull bars with long tails above.
Trading room
Al Brooks and other presenters talk about the detailed Emini price action real-time each day in the BrooksPriceAction.com trading room. We offer a 2 day free trial.
Market analysis reports archive
You can access all weekend reports on the Market Analysis page.


Thanks for the great analysis!
I was wondering which E-mini contract is used in the analysis?
I’m using ES1! on TradingView but I see some differences in the data.
Thanks
Dear Ahmed,
A good day to you.
I’m using the @ES.D continuous chart on Tradestation which is only cash hours.
The ES1! on TradingView includes extended market hours.
Take care and have a blessed new year ahead.
Best Regards,
Andrew
Dear Andrew, thanks for the report and a Very Happy New Year.
Question re the bull’s DB-BF composed from November 3rd and December 22nd. At which stage or what would you like to see PA wise happening to be convinced this is a workable DB and may take us to a MM with the December 11st neckline?
Best, Eli.
Dear Eli,
Happy New Year! Wishing a great 2023 ahead!
Good question.. let’s see..
1) Probably after a second leg sideways to down has more or less completed and,
2) The second leg is weak, and,
3) The context start favoring the large second leg sideways to up re-test Dec high argument.
If the second leg sideways to down is strong instead, then the Double bottom bull flag case would be shaky..
Take care and wishing a great week ahead!
Best Regards,
Andrew