E-mini end of day video review Trading Update: Monday March 30, 2026 S&P E-mini market analysis E-mini daily chart E-mini 5-minute chart and what to expect today Yesterday’s E-mini setups Richard created the SP500 E-mini chart. Here are reasonable stop entry setups from yesterday. Chart shows each buy entry bar with a green arrow and […]
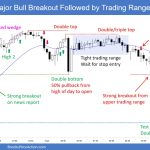
E-mini Bulls Want Buyers and Support at 6,800
Trading Update: Tuesday December 16, 2025 E-mini end of day video review Follow Joseph’s YouTube channel for more Al Brooks price action analysis. S&P E-mini market analysis E-mini daily chart E-mini 5-minute chart and what to expect today Yesterday’s E-mini setups Richard created the SP500 E-mini chart. Here are reasonable stop entry setups from yesterday. […]
E-mini Support At October 10th Close
Trading Update: Tuesday November 18, 2025 S&P E-mini market analysis E-mini daily chart E-mini 5-minute chart and what to expect today Yesterday’s E-mini setups Richard created the SP500 E-mini chart. Here are reasonable stop entry setups from yesterday. I show each buy entry bar with a green arrow and each sell entry bar with a […]
E-mini Finding Support at October 10th Breakout Point High
Trading Update: Wednesday November 5, 2025 E-mini end of day video review Follow Joseph’s YouTube channel for more Al Brooks price action analysis. S&P E-mini market analysis E-mini daily chart E-mini 5-minute chart and what to expect today Yesterday’s E-mini setups Richard created the SP500 E-mini chart – Al travelling. Here are reasonable stop entry […]
Emini 6,700 Likely to Become Resistance
Trading Update: Thursday September 18, 2025 E-mini end of day video review Follow Joseph’s YouTube channel for more Al Brooks price action analysis. S&P E-mini market analysis E-mini daily chart E-mini 5-minute chart and what to expect today Yesterday’s E-mini setups Al created the SP500 E-mini charts. Here are reasonable stop entry setups from yesterday. […]
Emini Support at Daily Moving Average
Trading Update: Thursday October 3, 2024 End of day video review See Price Action Rose’s YouTube channel for more Al Brooks price action analysis.You can also watch Joseph’s EOD Review for today on his YouTube channel. S&P Emini market analysis Emini daily chart Emini 5-minute chart and what to expect today Yesterday’s Emini setups Al […]
Emini Strong Bull Micro Channel at Resistance
Trading Update: Wednesday August 14, 2024 S&P Emini market analysis Emini daily chart Emini 5-minute chart and what to expect today Yesterday’s Emini setups Al created the SP500 Emini charts. Here are reasonable stop entry setups from yesterday. I show each buy entry bar with a green arrow and each sell entry bar with a […]
Emini at Important Support
Trading Update: Friday July 19, 2024 S&P Emini pre-open market analysis Emini daily chart Emini 5-minute chart and what to expect today Yesterday’s Emini setups Al created the SP500 Emini charts. Here are reasonable stop entry setups from yesterday. I show each buy entry bar with a green arrow and each sell entry bar with […]
Emini Finding Support at the March 8th Breakout Point
Trading Update: Thursday April 4, 2024 S&P Emini pre-open market analysis Emini daily chart Emini 5-minute chart and what to expect today Yesterday’s Emini setups Richard created the SP500 Emini charts (Al travelling). Here are reasonable stop entry setups from yesterday. I show each buy entry bar with a green arrow and each sell entry […]
Emini Inside Bar below Support
Trading Update: Tuesday February 6, 2024 S&P Emini pre-open market analysis Emini daily chart Emini 5-minute chart and what to expect today Yesterday’s Emini setups Al created the SP500 Emini charts. Here are reasonable stop entry setups from yesterday. I show each buy entry bar with a green arrow and each sell entry bar with […]

