Market Overview: FTSE 100 Futures
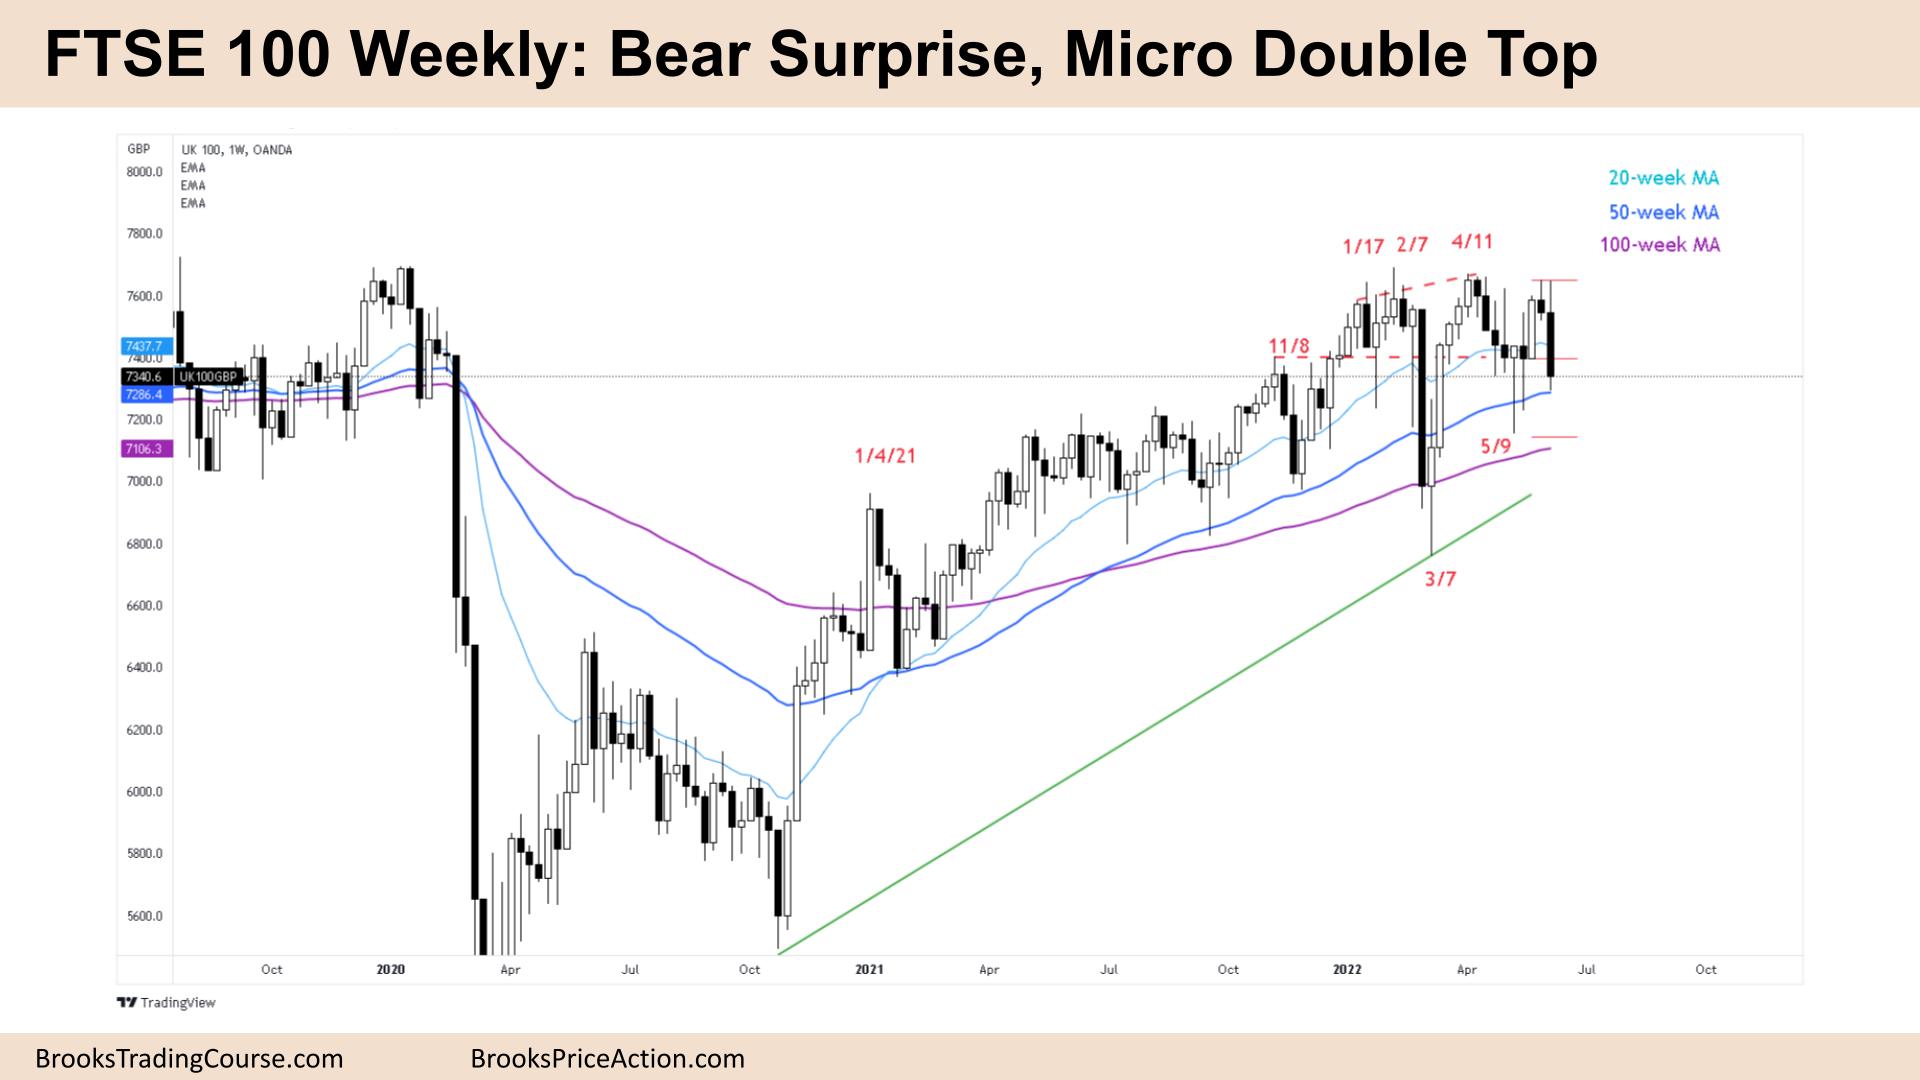
FTSE 100 bear surprise from a Micro Double Top (Micro DT) pausing at the 50-week moving average (MA). Once again the bulls failed and market made a lower high, so it’s a major trend reversal and traders will expect two legs sideways to down. We might have had the first leg. Bulls have been buying new lows around the moving averages and so expect them to scale in below bars.
FTSE 100 Futures
The Weekly FTSE chart

- The FTSE 100 futures was a bear surprise from a Micro Double Top (Micro DT) pausing at the 50-week moving average (MA.)
- The bar closed below its mid-point so we should trade lower next week. It had tails below it so it’s not as bearish as it could be.
- The bulls see a second-leg pullback from the April 11th tight bull channel. They will look for a High 2 around the moving average which is a reasonable buy setup.
- They see it is the 12th time we have paused at the 50-week moving average – what do you think might happen here? They know markets have inertia and tend to keep doing what they have been doing.
- Al says that if limit order bulls are making money then there is something wrong with the bear trend. It is likely to form a trading range if it is not already in one.
- It is not clear which trading range we are in, which is bad for stop entry traders. Traders want to buy low and sell high, but it is unclear so we might go sideways
- The bears see a failed breakout above a tight trading range. They see a lower-high, major trend reversal and expect two legs sideways to down and we might have completed the first leg.
- They see we have the lowest close in 6 weeks so they expect lower prices but they need a follow-through bar. Preferably one that closes below the moving average, or an inside bar with a Low 1.
- The location is bad for bears because traders have bought every bar below the moving average and only one bar in 18 months has been a moving average gap bar.
- So if you’re short, you might consider taking partial profits. If you’re an aggressive bull, you might buy here on a limit below the low because for the past 12 months that has been a very profitable strategy.
- We have been saying that this area since Nov 2021 has been a magnet and it could be in the middle of the trading range for the foreseeable future.
The Daily FTSE chart

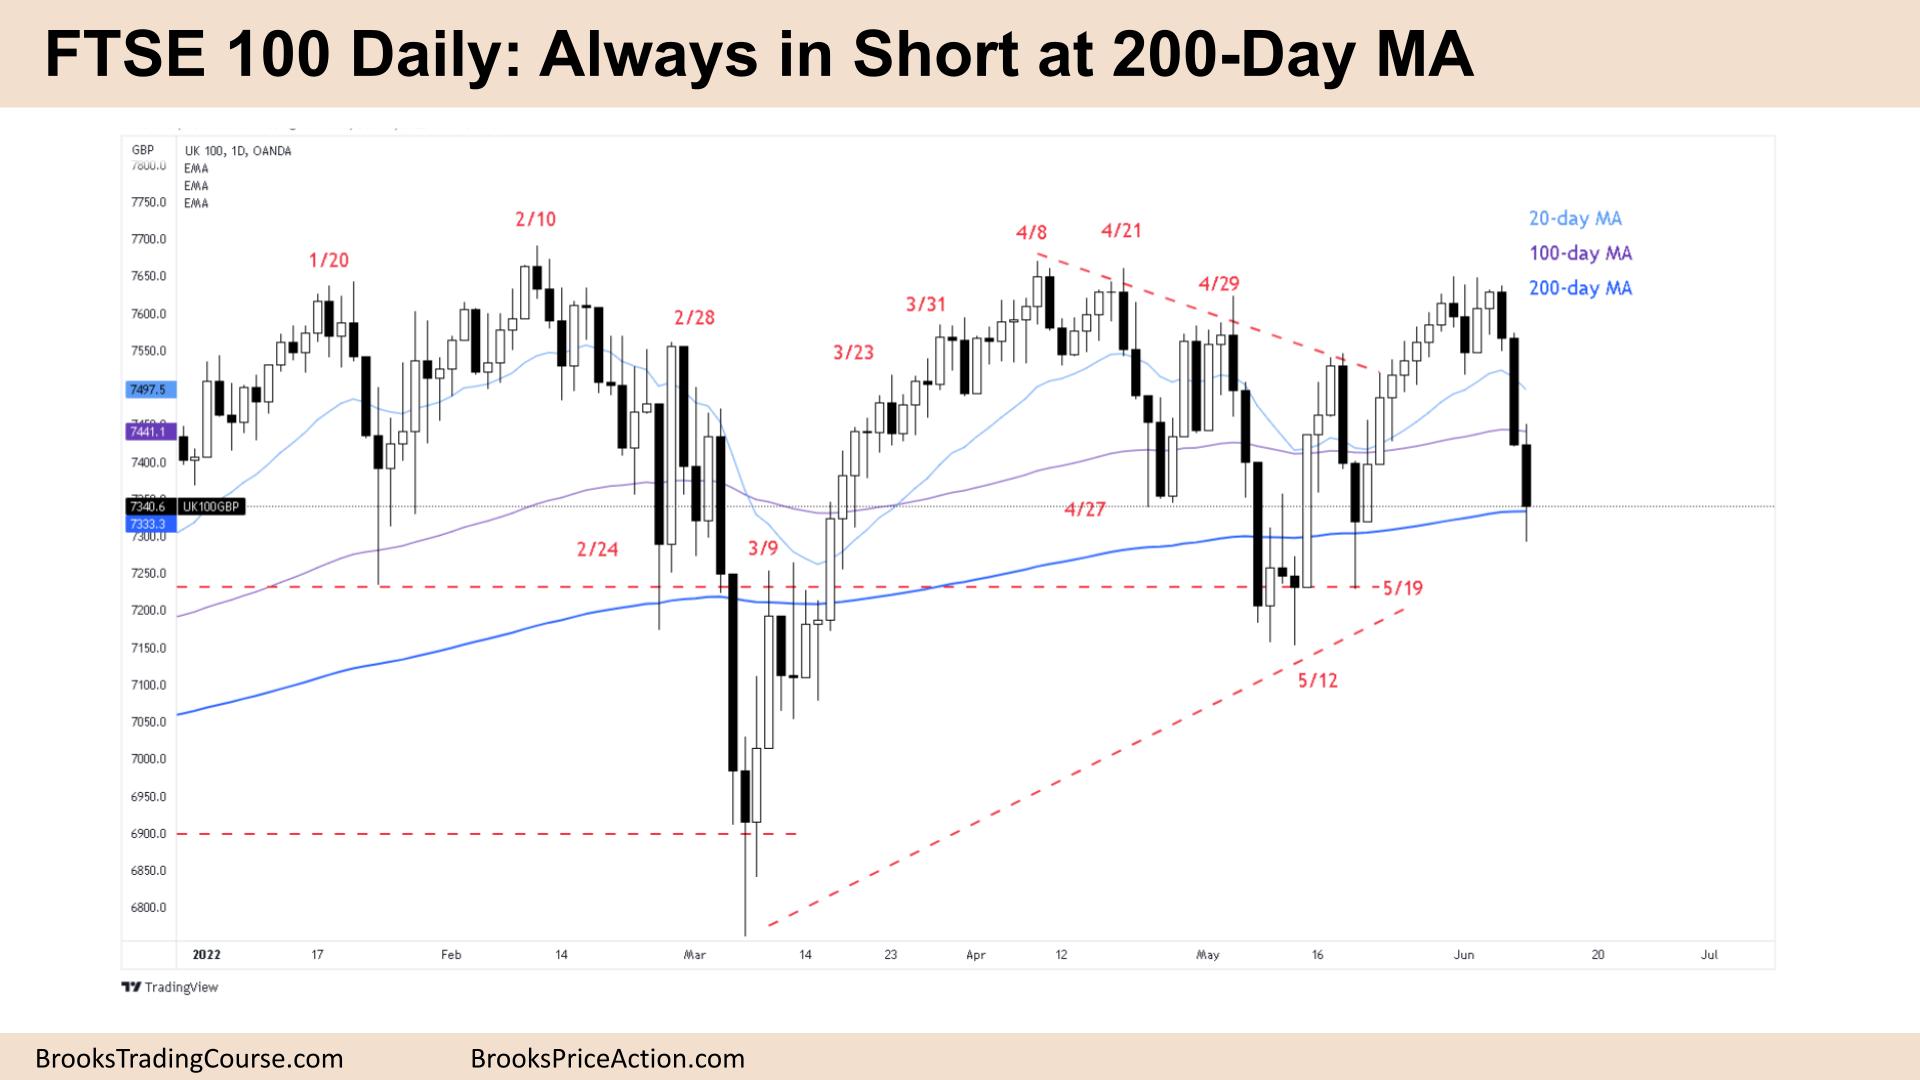
- The FTSE 100 futures on Friday was a consecutive bear surprise bar with tails above and below. It is the 4th consecutive bear bar so we will likely trade a little bit lower next week.
- We closed at 200-day moving average (MA) and it is the 4th time we have paused here, so we might go sideways to down next week
- The bulls see a double bottom with May 19th. They see an inverted head and shoulders and we are testing the neckline.
- They also see a higher low major trend reversal with May 12th.
- They see we broke the bear trend line from April 8th and expect two legs sideways to up which remains true.
- They see the consecutive bear bars as a sell climax at the bottom of a 4-week trading range where the math is now better for buys.
- The bears want a micro double bottom (Micro DB) or an inside bar here for a High 1 buy setup.
- How can the math be good for both bulls and bears? It’s 50/50 – because we are going sideways. Strong moves up, they sell. Strong moves down, they buy.
- Traders should take quick profits as reasonable targets and look for second entries if they are not yet profitable in this environment.
Market analysis reports archive
You can access all weekend reports on the Market Analysis page.