Market Overview: FTSE 100 Futures
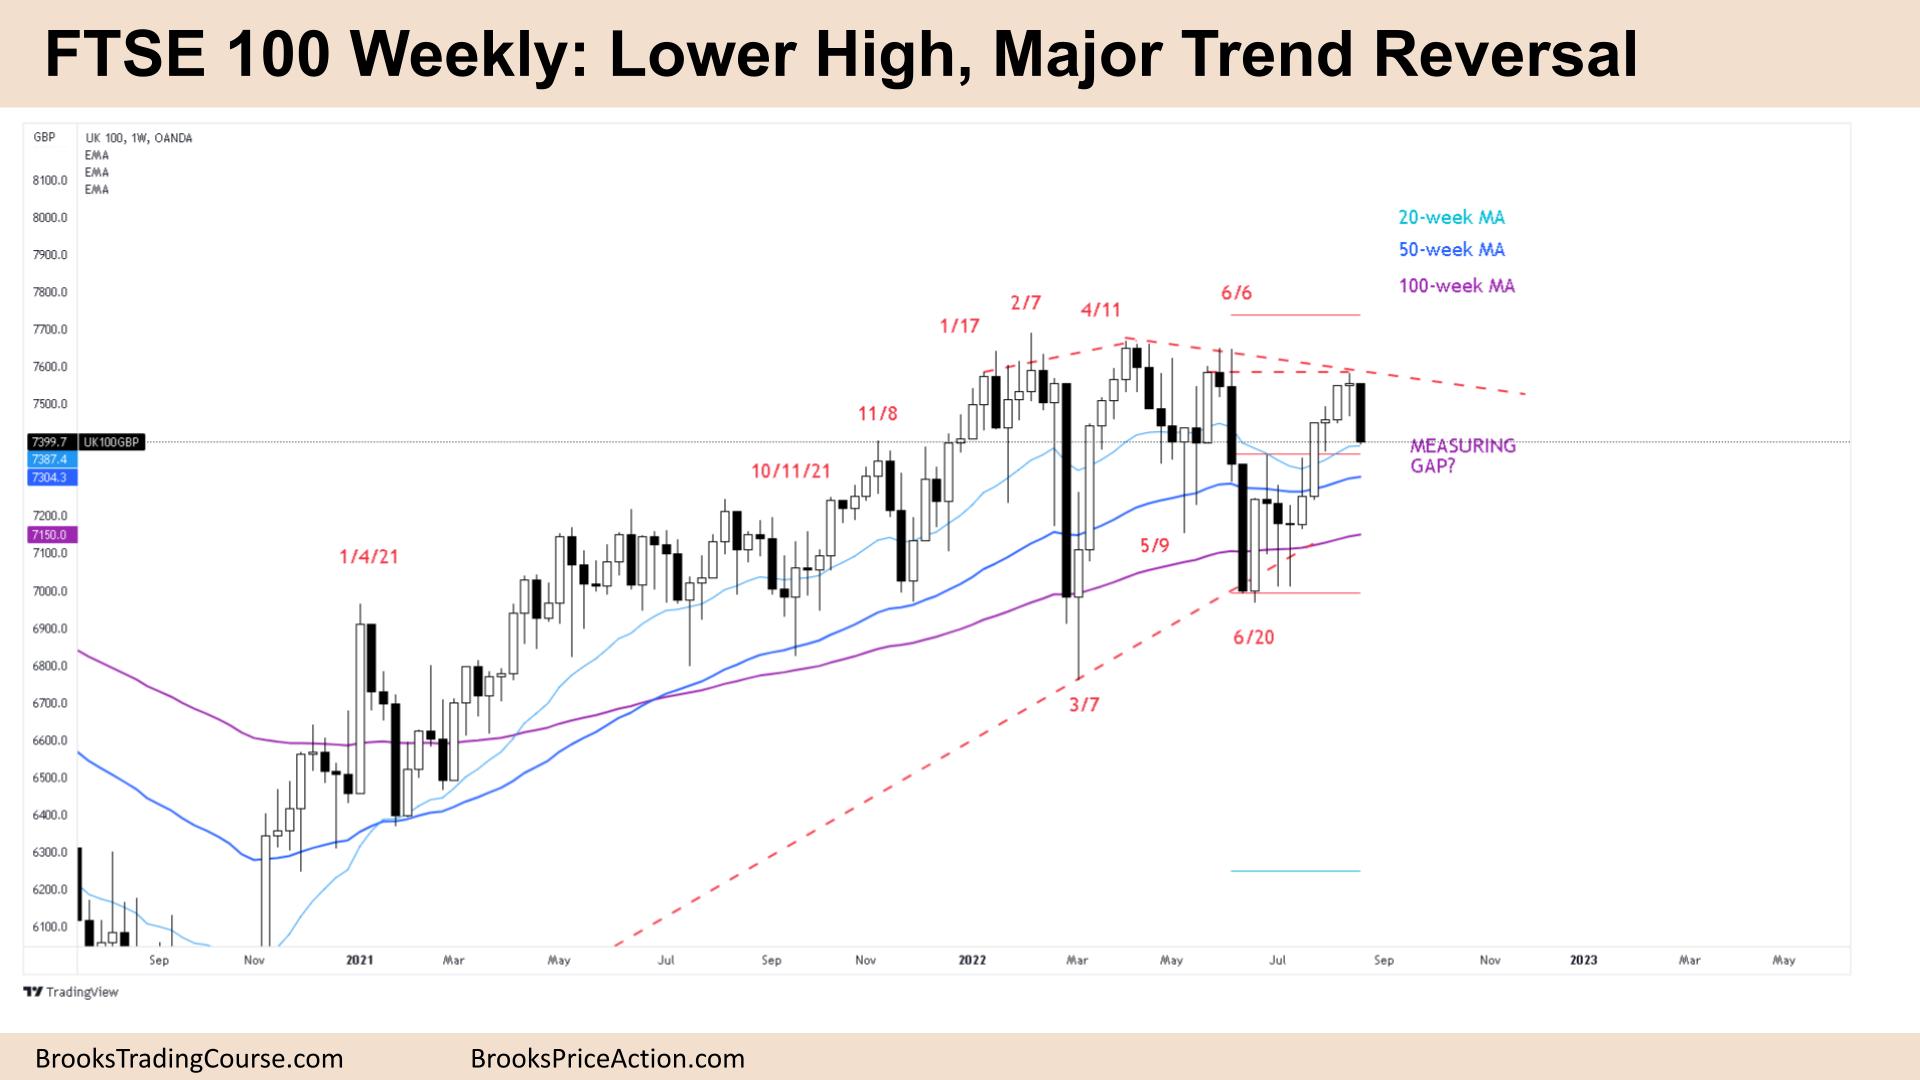
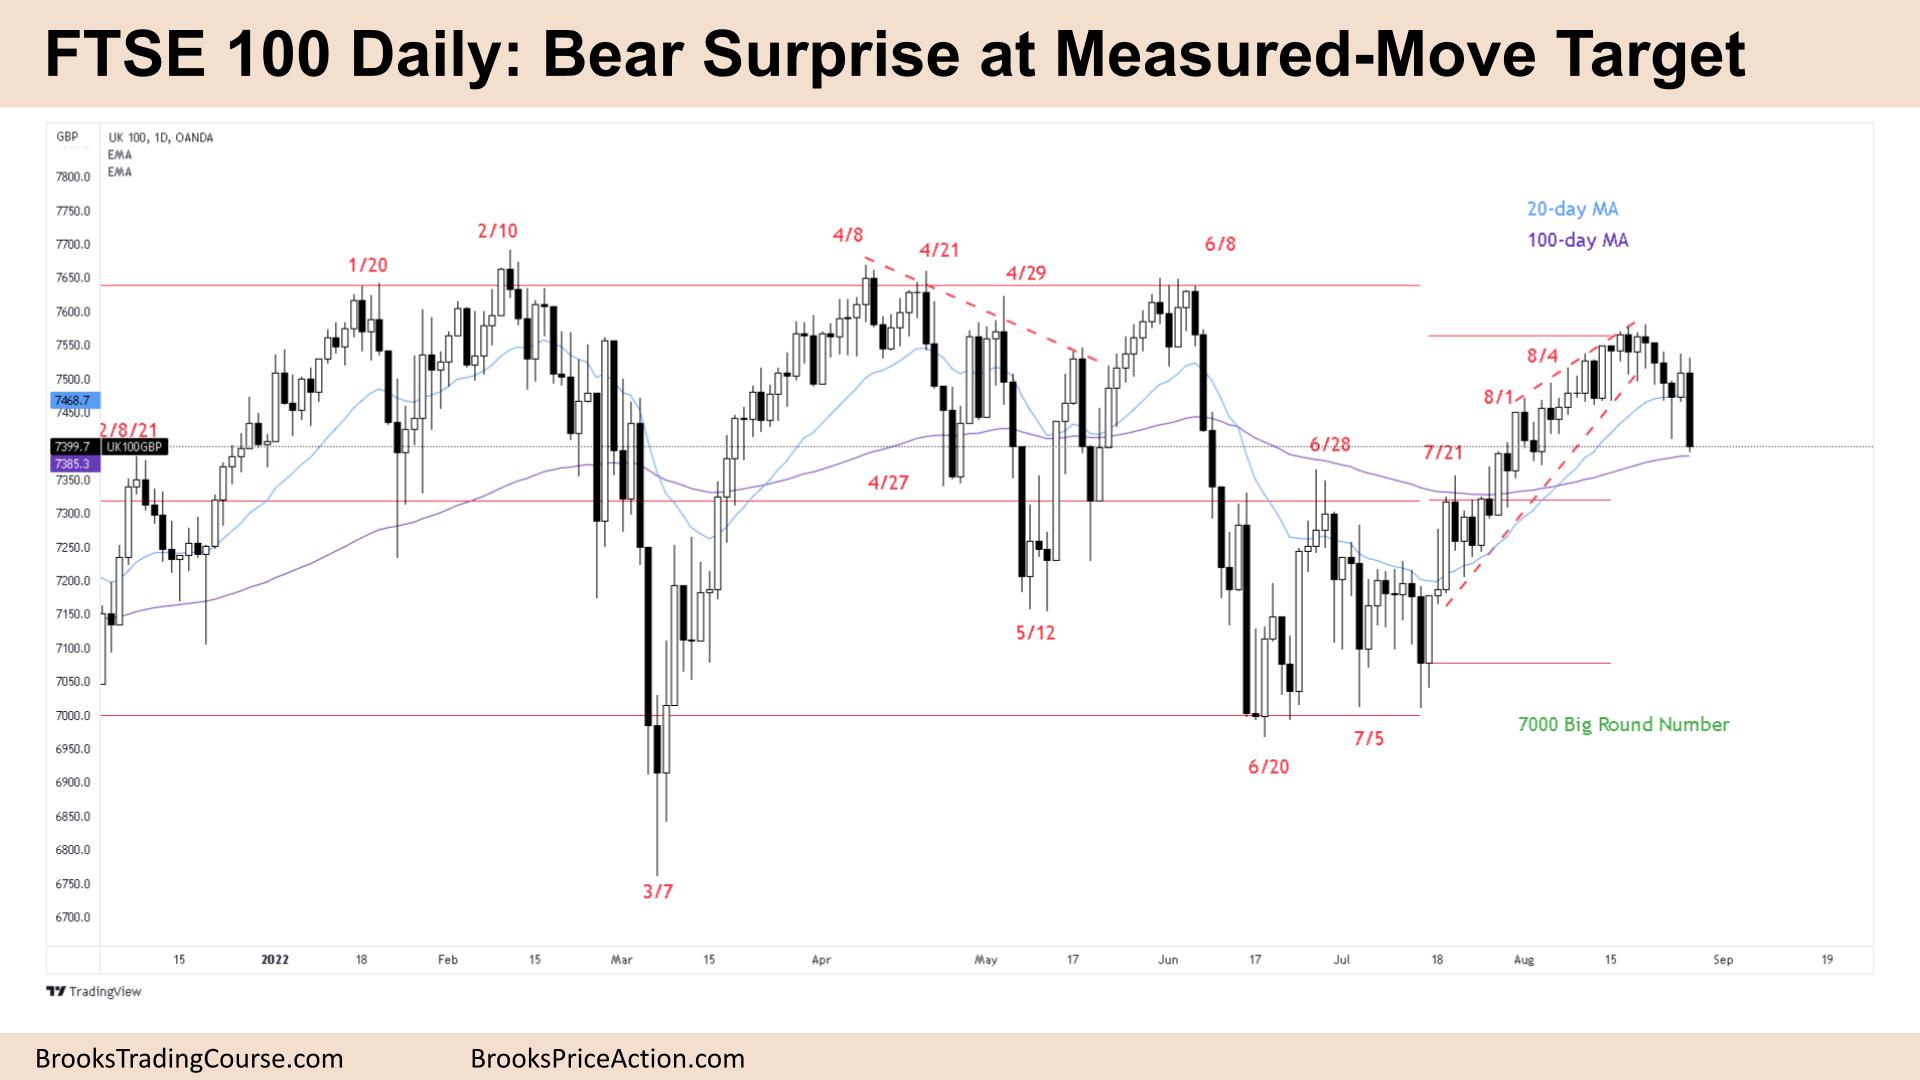
The FTSE futures market reversed down strongly with a bear surprise and a possible FTSE 100 lower high major trend reversal on the weekly chart. The bulls reached a measured move on the daily chart and traders expected a pullback. It wasn’t a great sell signal on the weekly chart, a bull doji, so we might need to pullback here at some point. Although it is a bear surprise bar we are right in the middle of a trading range and we might need another down week to switch to always in short.
FTSE 100 Futures
The Weekly FTSE chart

- The FTSE 100 futures weekly chart was a big bear surprise bar closing on it’s low, so we might gap down on Monday.
- For the bears, it’s a lower high, a major trend reversal. We reversed the past 3 bull bars so it is likely we will go a little bit lower next week.
- It was a Low 2 sell trading below last week and bears sold it strongly into Friday.
- But the bulls see we have a small gap three weeks ago so it is not as bearish as it could be.
- For the bulls, it’s a pullback in a bull spike and channel and we just finished the second leg.
- The bears want a consecutive bear bar closing below its midpoint so we can switch to always in short. It’s a strong bear bar which is a reasonable sell signal to trade with a stop above last week’s doji.
- Both traders know we are right back at the tight trading range from May which was a magnet.
- We have been saying for many months that we might oscillate around this point, it could be the middle of an ongoing trading range for the rest of the year.
- The bulls want a doji or a bull bar with a big tail below closing on its high for a possible High 2 buy above. But it’s a bad buy signal right now so most traders short be flat or short.
- At the top of the trading range, most traders should exit longs and look to sell short.
The Daily FTSE chart

- The FTSE 100 futures on Friday was a bear bar closing on its low so we might gap down on Monday.
- For the bulls, it’s a pullback after an extended bull channel and a small pullback bull trend. It’s a moving average gap buy setup, when there is a bar completely below the moving average. But it’s not there yet.
- For the bears, it’s a lower high and a reversal down from a measured move target, a minor trend reversal and a 50% pullback sell below Thursday.
- The bears want a close below Wednesday for a measured-move down. They need a consecutive bear bar to convince traders we are always in short.
- But we are right in the middle of a trading range and most traders want to buy low, sell high and scalp (BLSHS.) Big bars are a big risk and it might be too much risk for traders to sell there.
- The bulls want a reversal bar to buy above, closing above its midpoint setting up a High 2 buy and moving average gap bar pullback which is a reasonable trade in a bull trend.
- But the context is difficult because we are in the middle of the trading range
- More likely we trade sideways to down next week with two more possible legs.
- Bulls might look for a wedge bottom, and buy the third leg down above a strong reversal bar and scale in lower.
Market analysis reports archive
You can access all weekend reports on the Market Analysis page.