Market Overview: FTSE 100 Futures
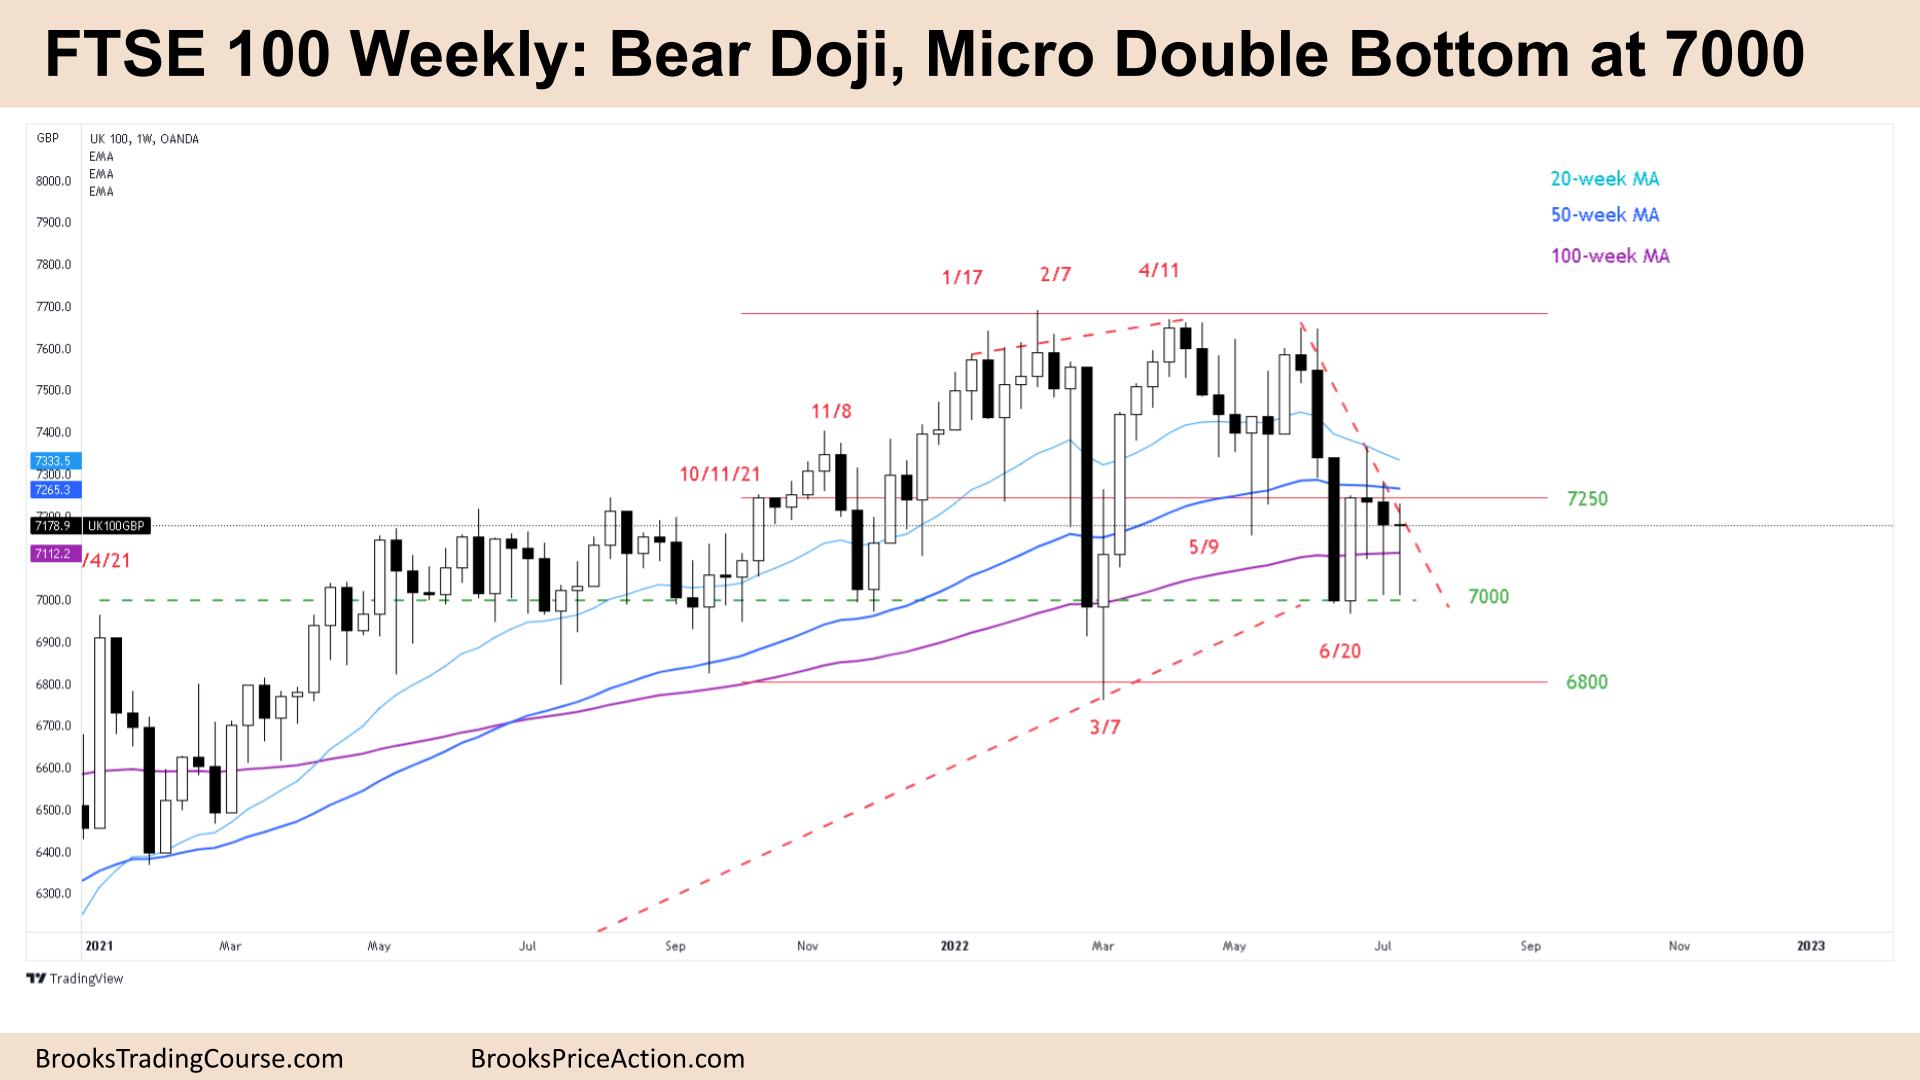
The FTSE futures market gave us a third bear doji last week. It moved only slightly lower last week with the possible micro double bottom on the weekly chart. Although in control, the bears were not able to get below 7000 for 2 weeks in a row so we might need to go up from here. The bulls are buying below bars, so we can expect a strong move up once we print a bull bar with a decent body closing on its high. Although that might need to be below 7000 before the market realizes it has gone too far.
FTSE 100 Futures
The Weekly FTSE chart

- The FTSE 100 futures weekly chart was a third consecutive bear doji. It was a few points away from an inside bar.
- If you’re confused that’s because it’s a tight trading range so expect reversals and strong setups to fail.
- The bulls see a micro double bottom with last week or a double bottom, higher low major trend reversal at the 100-week moving average (MA) with June 20th.
- The bulls want a High 2 buy setup low in the trading range up to the June highs. But after 3 bear bars, it is not a high probability setup. Bad entry signals usually get retested so the second entry often has higher-probability.
- The bulls might need a small inside bull bar and then trade above for bears to exit. They see the support at 7000 as the bottom of the trading range and know bears are not willing to swing below.
- This could be the bottom of the range for the next year like it was last year.
- The bears see three consecutive bear bars late in a bear trend. Although they were bear doji’s, 3 lower closes are still strong and they expect the first reversal to be minor.
- Because they hit 6800 you could see it as the end of the measured move and now moving up. But the June selling was so strong it makes you think if the second leg will need to be slightly lower. Perhaps we are at the end of it here.
- It has been 7 weeks and only one week has traded above the high of a prior week. It’s likely bears will look to scale in on pullbacks. They see we are far below the moving average and will likely sell higher.
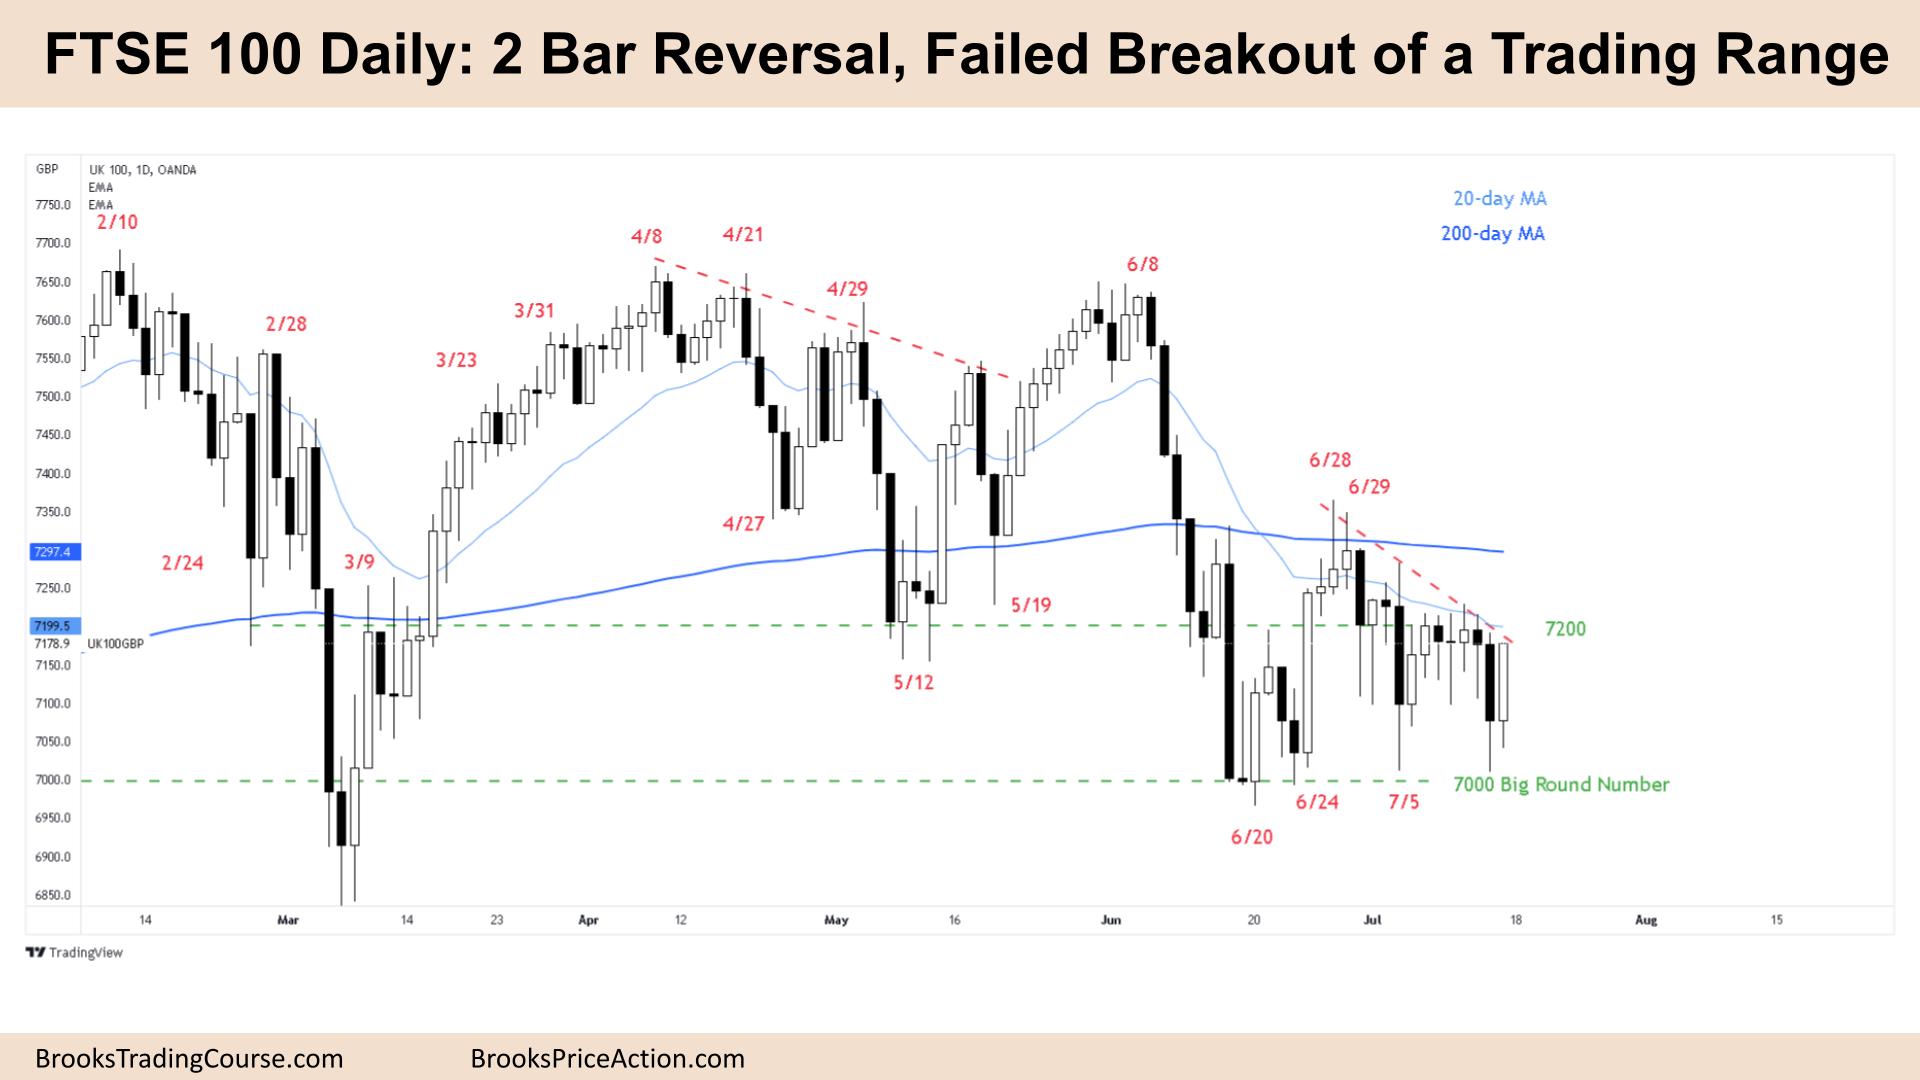
The Daily FTSE chart

- The FTSE 100 futures ended Friday with a strong bull bar closing on its high so we might gap up on Monday.
- The bulls see a failed breakout short, a 2 bar reversal and possible double bottom with July 5th. It’s a buy signal in a wedge bottom or reversal but we are still below the moving average so it’s a low probability.
- With the past 11 bars below the moving average are there more likely buyers or sellers above? Probably sellers.
- The bears see a bear channel now in a trading range so they are looking to buy low sell high and scalp (BLSHS.) It’s tricky to see where the top of the range is. Because of that expect limit order trading and scalping.
- They see Friday as a pullback test of Wednesday and Thursday, a breakout of a tight trading range/barbwire at the moving average and are looking for another leg down.
- The bears see Friday as a bull trap and will sell strongly above. The question is whether it is above the high of the barm like the past 2 weeks or up at the June 29th high?
- Tight trading range, triangle, wedge bottom – it all looks tight and unclear so traders should trade it like it is unclear and expect breakouts to fail and stop entries also to fail.
- The bulls might get a strong Monday, maybe even Tuesday before a moving average gap sell signal for the bears, a Low 1 sets up.
- The bears might get a strong bear reversal/outside down bar, only to lack follow-through at the June lows.
Market analysis reports archive
You can access all weekend reports on the Market Analysis page.