Market Overview: FTSE 100 Futures
The FTSE futures continued higher with 4 weekly bull bars but failed to close above the highs of January or February so it is not as bullish as it could be. We are at the highs of a trading range and with tails on top it is reasonable to scale into shorts here. The bulls want a high 1 to trigger a move up while the bears look for another climactic selloff like last month.
FTSE 100 Futures
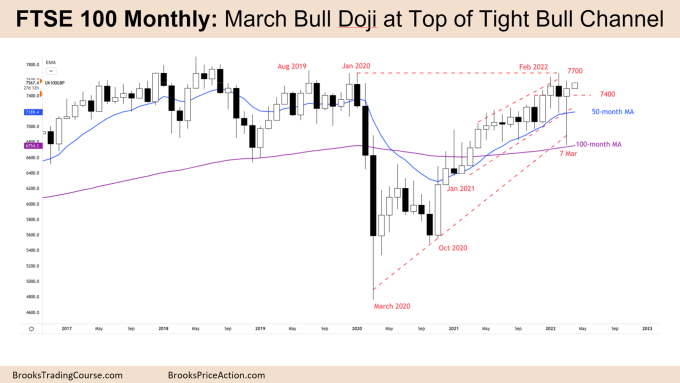
The Monthly FTSE chart

- The monthly chart FTSE futures continued higher with a bull doji and large tail below and small tail above.
- Even though March traded below the lows of the 11 previous months, it closed back at the same level as February.
- This area has been a tight trading range before and so is a magnet and we will likely continue to go sideways.
- The bulls want to get a high 1 buy by trading above March, but we haven’t closed above 7550 since August 2019, so although we are currently above, by the end of the month it is reasonable to expect we will trade lower.
- We failed to break above the bull channel and then failed to break below it. 80% of breakouts fail so we will likely go sideways to up.
- Even if we do trade lower however, buyers have been below each month for well over a year so the pullback is likely to be brief.
- The bulls see a tight bull channel for over 12 months, a possible wedge, with buyers below prior bars. This remains true.
- The bulls see the sell climax as proof the trend is intact and we should go higher up above the pre-COVID high.
- Bulls want to get a close above 7500 to convince traders we can breakout above the wedge for a test of the all time high at 7900.
- The bears look left and see we are at the top of a trading range going back many years and know even if we trade higher, we haven’t had a successful breakout.
- They also see the sell climax in March as indication the bulls are not as strong as they could be.
- The bears want another tail on top this month and a bear close to setup a low 1 short at the top of a trading range.
- But the bears have failed to get consecutive bear bars on the monthly chart since COVID so they might fail to get the breakout down for many months.
- Likely we will go sideways to up, assuming that any moves lower will be bought up again.
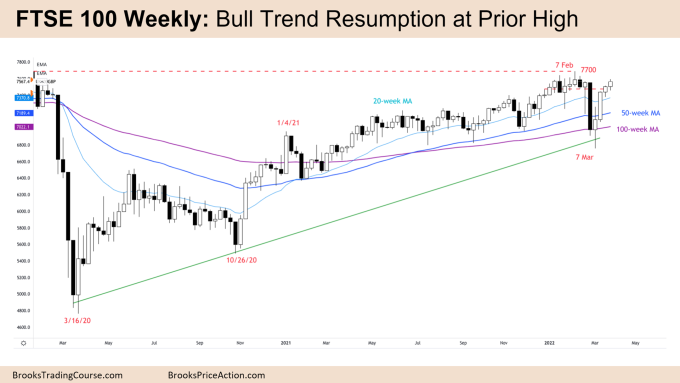
The Weekly FTSE chart

- The FTSE Weekly candlestick was a small bull bar with tails above and below.
- It’s now 4 weekly bull bars in a row. The last time the FTSE had 5 bull bars was in October 2020. It is reasonable to assume next week we will at some point trade lower.
- If however next week we get another bull bar it might convince traders we can break through the 7600 area we have struggled to get a weekly close over since pre-COVID.
- Even though the prior 2 weeks closed on their highs, now we have tails above and below meaning it is not as bullish as it could be.
- Bulls see a tight bull channel and a trend resumption up from a pullback to the 50-week and 100-week moving averages.
- The bears see a bull leg in a trading range right up to where the bear breakout started.
- When the chart is confusing that is the hallmark of a trading range.
- We have returned to the previous 9-week tight trading range which is a magnet
- The bulls want to stay in this range to convince traders we can go and test the pre-COVID all time highs. A close above 7600 at least on the weekly chart might do that.
- But their maths is not great buying at the top of a trading range.The bears want a pullback, a low 1 short at the top of the trading range to then test the Mar 7 lows.
- Because we haven’t traded below the low of a prior bar in 3 bars, they know it is reasonable that the next time we do that bulls will buy pullbacks.
- Because the low 1 will be a more reasonable sell it could be climatic like the last bear surprise bar from this price.
- If instead the bulls get a failed low 1, that might convince traders we are going higher.
- Looking left at the context we can see many tails above bars so it is likely sellers above looking for a second leg down.
- Markets rarely go straight up or straight down unless in a trading range so no matter how bulllish it is, at the extreme of the ranges there can be big moves.
Market analysis reports archive
You can access all weekend reports on the Market Analysis page.
thanks!
Great analysis Timothy, thanks alot! All best from the Low Countries