Emini and Forex Trading Update:
Friday March 5, 2021
I will update again at the end of the day.
Pre-Open market analysis
The Emini formed its 3rd consecutive big bear day on the daily chart yesterday. It temporarily dropped back below last year’s close, erasing the 2021 gains. On last Friday, I said that there is a 60% chance that this is the start of about an Emini 10 percent correction, and yesterday only reinforced that view. The minimum goal is a drop below the November 9 high, because that was resistance and then support for about a month.
The next target is the November 10 low at the start of the wedge bull channel. On the monthly chart, a minimum target is the September high. It could continue down to the September low, which is the bottom of the most recent leg up on the monthly chart.
But what about today? The Emini is very oversold on the daily chart. Also, it has had 3 legs down, and therefore the selloff is a wedge sell climax. That typically attracts profit takers, which increases the chance of a bounce for at least a day or two. But at the moment, there is a 60% chance it will work lower over the next few weeks. Traders should sell rallies. The bulls need at least a couple consecutive big bull days to turn the chart back to neutral.
Today is Friday, so weekly support and resistance can be important, especially in the last hour. Magnets include the 2020 close, the 20 week EMA below, the open of the week, and last week’s low.
Overnight Emini Globex trading
The Emini is up over 35 points in the Globex session. The day after a sell climax day has a 75% chance of at least a couple hours of sideways to up trading, starting by the end of the 2nd hour. Also, there is a wedge bottom on the daily chart. Additionally, the Emini reversed up yesterday from a sell climax at the important support of the close of last year, and from just above the 3,700 Big Round Number.
Finally, a streak of 3 consecutive big bear days is unusual. Today will probably not be a 4th. In fact, there is an increased chance of today closing above the open. Also, with the selloff being so climactic, there is an increased chance that today will be a bull trend day.
Yesterday’s setups

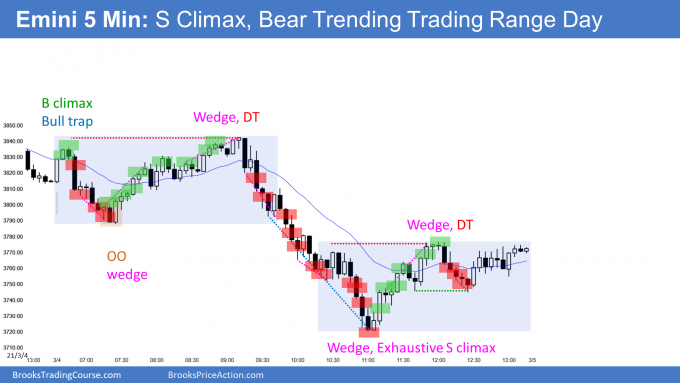
Here are several reasonable stop entry setups from yesterday. I show each buy entry with a green rectangle and each sell entry with a red rectangle. Buyers of both the Brooks Trading Course and Encyclopedia of Chart Patterns have access to a much more detailed explanation of the swing trades for each day (see Online Course/BTC Daily Setups).
My goal with these charts is to present an Always In perspective. If a trader was trying to be Always In or nearly Always In a position all day, and he was not currently in the market, these entries would be logical times for him to enter.
If the risk is too big for your account, you should wait for trades with less risk or trade an alternative market like the Micro Emini.
EURUSD Forex market trading strategies

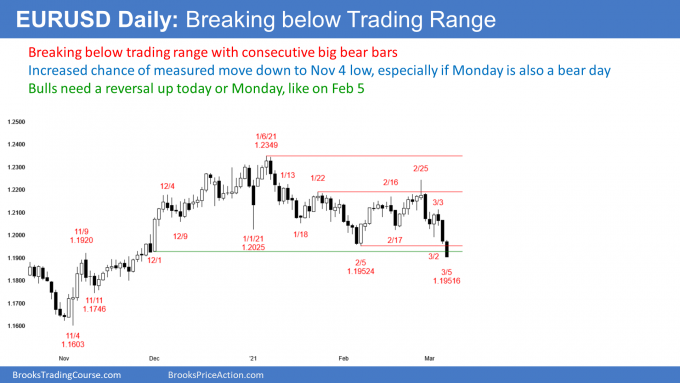
The EURUSD Forex market on the daily chart yesterday had a big bear bar closing on its low. Today is breaking below the 3-month trading range and so far, it too is a big bear day closing on its low. If today closes on the low, there would be consecutive big bear day in a breakout. Traders will expect a measured move down to the November 4 low at 1.16.
While there are 2 bear days, today is the 1st breakout day. Monday is the follow-through day. At a minimum, the bears want at least a small bear body. Consecutive closes below the trading range is a confirmed breakout. It significantly increases the chance of a measured move down.
If today reverses up and closes above the February 5 low, or if Monday is a big bull day similar to February 5, traders will wonder if the breakout is failing. The bulls will need a series of bull days, like after February 5, to make traders believe that the selloff is only a big High 2 pullback from the January high.
Currently, traders expect the selloff to continue to 1.16. What happens over the next few days will increase or decrease that probability.
Overnight EURUSD Forex trading
The 5-minute chart of the EURUSD Forex market has trended down overnight, but it was in a tight trading range until 15 minutes ago. It just broke strongly below that range, but it is reversing up from the 1.19 Big Round Number.
A trading range is an area of agreement. Traders think the price is fair. A trading range late in a bear trend is a magnet, and a possible Final Bear Flag.
The bulls hope the reversal gets back into that trading range. If it does, then we probably have seen the low of the day. Also, today would have a big tail below on the daily chart. That would reduce the strength of the bear breakout. Monday, then, would be more important. Will it resume the bear breakout on the daily chart or continue the reversal up?
When a market reverses back up into a trading range, it can continue up to the high of the day. More often, it gets stuck in that trading range, and again goes sideways. Less often, it resumes down and closes at the low.
Summary of today’s S&P Emini futures price action and what to expect tomorrow

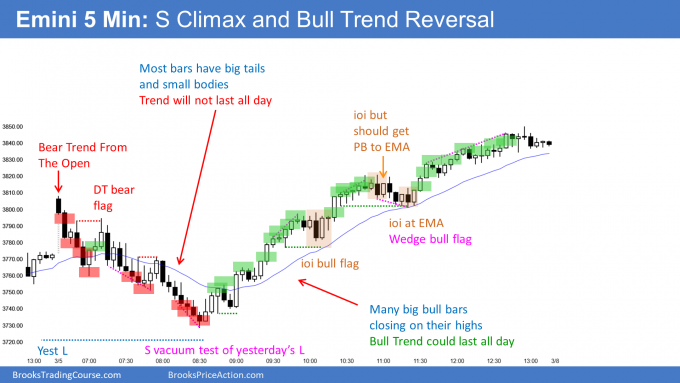
Here are several reasonable stop entry setups for today. I show each buy entry with a green rectangle and each sell entry with a red rectangle. Buyers of both the Brooks Trading Course and Encyclopedia of Chart Patterns have access to a much more detailed explanation of the swing trades for each day (see Online Course/BTC Daily Setups).
My goal with these charts is to present an Always In perspective. If a trader was trying to be Always In or nearly Always In a position all day, and he was not currently in the market, these entries would be logical times for him to enter.
If the risk is too big for your account, you should wait for trades with less risk or trade an alternative market like the Micro Emini.
End of day summary
The Emini sold off in a weak bear trend on the open. I said in the chat room that it would probably reverse up from above yesterday’s low and it did. It then rallied strong to a new high of the day. and above of the 60-minute EMA and the midpoint of the week. It broke above yesterday’s high just before the close. When there is a huge selloff on the open and then a reversal, the Emini usually has a hard time going far above the high of the open. Today was an exception and the rally went quite a bit above the earlier high.
Today formed a micro bottom with yesterday’s low on the daily chart. Since there is also a wedge bottom, the Emini might go sideways to up for a couple legs next week. While today was good for the bulls, the daily chart is still slightly more bearish than bullish. The bulls will need consecutive strong bull bars to undo the consecutive big bears bars from this week and from last week.
See the weekly update for a discussion of the price action on the weekly chart and for what to expect going into next week.
Trading Room
Traders can see the end of the day bar-by-bar price action report by signing up for free at BrooksPriceAction.com. I talk about the detailed S&P Emini futures price action real-time throughout the day in the BrooksPriceAction.com trading room. We offer a 2 day free trial.
Charts use Pacific Standard Time
When I mention time, it is USA Pacific Standard Time (the Emini day session opens at 6:30 am PST, and closes at 1:15 pm PST). You can read background information on the intraday market reports on the Market Update page.
Just want to confirm, After the bear rally, when on EMA there was a bear bar, you predicted that it probably will end in a small PB bull trend. Were you expecting Small PB Bull trend because the previous PA made you think that the bear trend will not last all day? Are there any other indications which foretell a small PB trend on a day like Friday?
Thanks
I don’t know if you were in the trading room, but I pulled up several examples of strong bear trends that reversed up from just above yesterday’s low and trended up all day. I also kept saying that the selloff does not look like a trend that can last and that a reversal up was likely.
Thanks for the reply Al, I am not yet subscribed to trading room. Signing up for it is how I plan to celebrate the first month I take profits out of my trading account. Let’s see how soon I am able to ask you a question live in the trading room 🙂
A reversal up from a protracted sell climax from the open often becomes a Small Pullback Bull Trend. I talked about that in the chat room.
Emini daily. After today’s session, you summarized the daily chart as still slightly more bearish. Is the sell the rally premise still intact or did today’s session change that premise? Thank you very much for clarifying.
I will write about this in the weekend update.
Awesome job today in the trading room, Dr. Brooks. You’re a gamer for powering through the Covid backlash.
The Covid VACCINE backlash. Hope I didn’t accidentally scare anyone into thinking you had actual Covid!!