Trading Update: Monday October 4, 2021
Emini pre-open market analysis
Emini daily chart
- Friday was a big bull reversal bar. It was the 2nd reversal up from below the August trading range. There is now a lower low double bottom with the September 30 low. A 2-month trading range.
- However, Friday had a big tail on top. That represents hesitation by the bulls, and it reduces the chance of a resumption of the 2021 bull trend from here.
- Also, September was a bear bar on the monthly chart. That is probably the start of a 2- to 3-month sideways to down correction.
- The 4-week selloff broke far below the bull channel on the weekly chart.
- There is at least a 50% chance that the weekly Small Pullback Bull Trend has ended.
- If so, the correction should continue down for at least 15%, which is 50% bigger than the biggest pullback in the Small Pullback Bull Trend.
- Since the September selloff lasted a lot of bars and the Emini is trying to hold at the bottom of the August trading range, the Emini could bounce up to the September 23 lower high.
- The bears hope that the Emini is in a bear trend. They have a 50% chance of being right. If they are, a 1- to 2-week rally from here should fail around the September 23 lower high.
- The bears want a double top with that high. A measured move down would be around 4100.
- A bear trend is a series of lower highs and lows. Each lower high is a failed reversal attempt. That means a bear trend typically has many strong rallies.
- Remember, the minimum target on the weekly chart is 15%, which is around 3850. That is below the gap above the April 1 high and below the 4,000 Big Round Number.
- On the monthly chart, the selloff should last at least 2 to 3 months. Therefore, if the high for the year is in, the Emini should fall below 4,000 this year.
- I have been saying that there is a 50% chance that September 2 will remain the high for the year. That means there is a 50% chance of a new high.
- But if there is a new high this year, it will probably fail to get much above the September high since the monthly buy climax is extreme and the Emini has been sideways for 3 months.
- The bulls need to get bull bars closing near their highs and they need a strong break above the September 23 lower high before traders will conclude that the correction has ended.
Emini 5-minute chart and what to expect today
- Emini is down 5+ points in the overnight Globex session.
- Traders are deciding if Friday’s profit taking will be the start of a rally up to the September 23 lower high or just a pause in the September bear trend.
- The day after a buy climax day only has a 25% chance of being another strong bull day.
- There is a 75% chance that today will have at least a couple hours of sideways to down trading that begins by the end of the 2nd hour.
- Also, the Emini is back in Wednesday and Thursday’s trading range and around the bottom of the August trading range. That further increases the chance that it could stall here for a few days.
- Confusion is a hallmark of a trading range. The Emini might be forming a trading range since the September 20 low.
- If today is a trading range, there should be at least one swing up and one swing down since Friday’s range was so big.
EURUSD Forex market trading strategies
EURUSD Forex daily chart

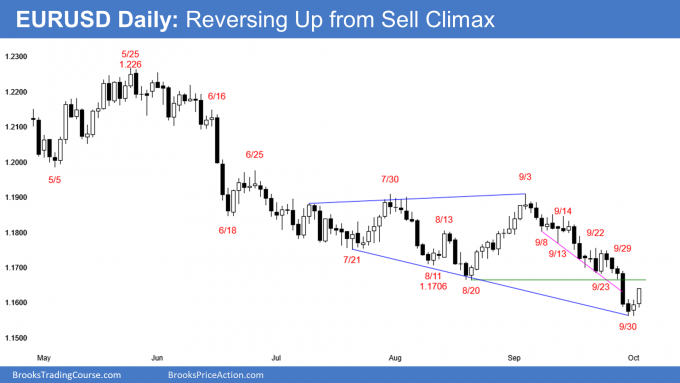
- Expanding Triangle and failed breakout below tight bear channel.
- Reversing up from September 29 sell climax. Traders expect at least a couple legs sideways to up to the top of the most recent sell climax, which was the big bear bar of September 29.
- That is also above the August 20 breakout point.
- Since at bottom of yearlong trading range after strong rally in 2020, the entire selloff is probably just a leg down in the trading range.
- There is only a 40% chance that the selloff will continue down to last year’s low without at least a 50% retracement of the selloff from the May high. That is around the September 3 high.
- Because the September bear channel was tight, the first leg up will probably be minor. That means that there will probably be a test back down, even if the current rally lasts a few weeks.
- If there are several bull bars closing near their highs this week, this rally will probably last at least a couple weeks.
- If there are bear bars closing near their lows this week, the bear trend will probably continue a little longer.
- However, since the EURUSD is at the bottom of a yearlong trading range and the 2020 rally was stronger than the 4-month selloff, the odds are against the selloff falling much below the June 10, 2020 high at around 1.14. That was the Breakout Point of last year’s strong breakout.
Summary of today’s S&P Emini futures price action and what to expect tomorrow

End of day summary
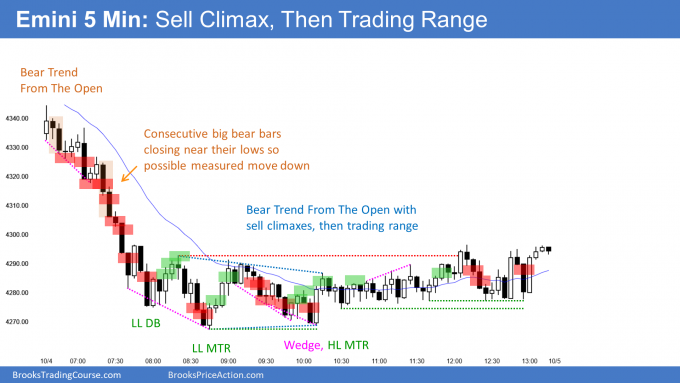
- Bear Trend From The Open.
- After measured move down to below Friday’s low, Emini entered trading range.
- 50% chance that September is start of 15% correction.
- So far, correction on daily chart is bear channel, so better to sell rallies.
- Bulls will buy selloffs for 2- to 3-day bounces.
- Since oversold and possible double bottom with September 20, probably will try to bounce this week. If not, then increased chance that 15% correction has begun.
- Currently more likely that Emini will fall below 4,000 before making new high. But several strong bull days will flip the probability in favor of a new high.
See the weekly update for a discussion of the price action on the weekly chart and for what to expect going into next week.
Trading Room
Traders can see the end of the day bar-by-bar price action report by signing up for free at BrooksPriceAction.com. I talk about the detailed S&P Emini futures price action real-time throughout the day in the BrooksPriceAction.com trading room. We offer a 2 day free trial.
Charts use Pacific Time
When I mention time, it is USA Pacific Time. The Emini day session charts begin at 6:30 am PT and end at 1:15 pm PT which is 15 minutes after the NYSE closes. You can read background information on the market reports on the Market Update page.