Emini and Forex Trading Update:
Wednesday April 15, 2020
I will update again at the end of the day.
Pre-Open market analysis
After an early selloff yesterday, the Emini reversed back up. The 4 week bull trend has been strong. Also, the 50 day simple moving average and the March 10 lower high are magnets above.
The bulls were hoping that the Emini reaches those targets. However, the overnight selloff reduces the chances. Also, the Emini entered the sell zone once it went above the 50% pullback level.
Traders have known that there would soon be a test down to the April 1 higher low starting soon. This is because they expect that the Emini will continue in a trading range for many months. The odds are high that every leg up in a trading range eventually reverses into a leg down and vice versa.
If today is the start of a reversal down, the 3 week rally would have 3 legs up. It would therefore be a wedge lower high. Traders would then expect at couple legs down to the April 1 higher low over the next few weeks.
Overnight Emini Globex trading
The Emini is down 75 points in the Globex session. It will gap down far below yesterday’s close and it might also gap below yesterday’s low. Yesterday would be a 1 day island top. Remember, the the April 1 low was part of a 3 day island bottom. Island tops and bottoms are common in trading ranges and they typically are minor reversal patterns.
Today will open with a big gap below yesterday’s close. The Emini will therefore be far below the average price (the EMA) on the 5 minute chart. When that is the case, there is an 80% chance of early trading range trading.
There are 4 common patterns in this Breakout Mode type of open. The bears will look to sell a double top or wedge top near the EMA, expecting a swing down. However, the bulls will want to buy a double bottom or wedge bottom for a swing up.
There is only a 20% chance of a strong trend from the open up or down. If there is one, down is slightly more likely than up because of the gap being down.
Day traders should always be ready for anything. However, they will most likely see a trading range open for the 1st hour or two. They should then look to trade one of the 4 patterns that I just mentioned.
Yesterday’s setups

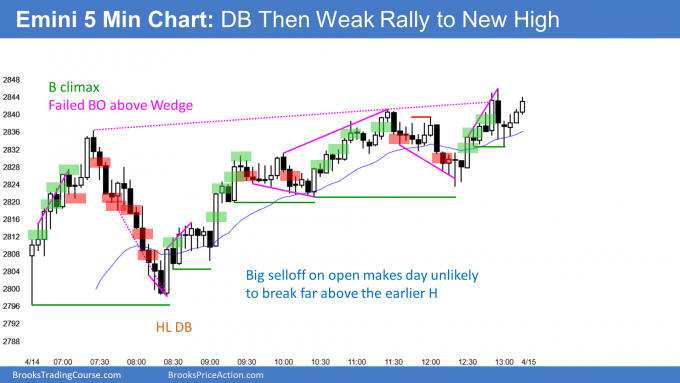
Here are several reasonable stop entry setups from yesterday. I show each buy entry with a green rectangle and each sell entry with a red rectangle. I rarely also show limit order entries and entries on the close of bars. Buyers of the Brooks Trading Course and Encyclopedia of Chart Patterns have access to a much more detailed explanation of the swing trades for each day (see Online Course/BTC Daily Setups).
My goal with these charts is to present an Always In perspective. If a trader was trying to be Always In or nearly Always In a position all day, and he was not currently in the market, these entries would be logical times for him to enter.
If the risk is too big for your account, you should wait for trades with less risk or trade an alternative market like the Micro Emini.
EURUSD Forex market trading strategies

Today’s candlestick on the daily chart of the EURUSD Forex market reversed down from above yesterday’s high to below yesterday’s low. Today is an outside down day.
I have said several times that the 1st breakout of the diamond pattern would have a 50% chance of failing. This is what a failure looks like.
The 2 week rally has been a small wedge. Today is now a sell signal bar for tomorrow. It will have a higher probability of beginning a move down to the April 6 higher low if today closes near its low and below yesterday’s low.
If instead today closes above yesterday’s low, it will be a weaker sell setup. And if it closes in the middle of the range, tomorrow will probably be sideways. The bulls would then still have a 50% chance of the rally continuing sideways to up for at least a few more days.
Overnight EURUSD Forex trading
The 5 minute chart of the EURUSD Forex market sold off from above yesterday’s high to below yesterday’s low. The selloff has been in a Small Pullback Bear Trend. Day traders have only been selling, and many have been swing trading.
Because the trend has been strong, they have been selling for any reason. That includes selling at the market and at the low.
While there is no evidence that this is about to end, it is unlikely to continue all day. The bears have achieved their goal. They created an outside down day and they are triggering a wedge reversal.
Their goal will soon switch. Although they would like the trend to continue all day, they are much more interested at this point in keeping what they have already accomplished. They therefore will begin to take profits and then sell rallies.
If there is a 30 pip profit taking rally, which is likely, the bulls will start to buy reversals up from the low for scalps. The result of the bears selling rallies and bulls buying selloffs will be a trading range. That should begin within a couple hours. It will still probably be easier to make money as a bear all day.
Summary of today’s S&P Emini futures price action and what to expect tomorrow

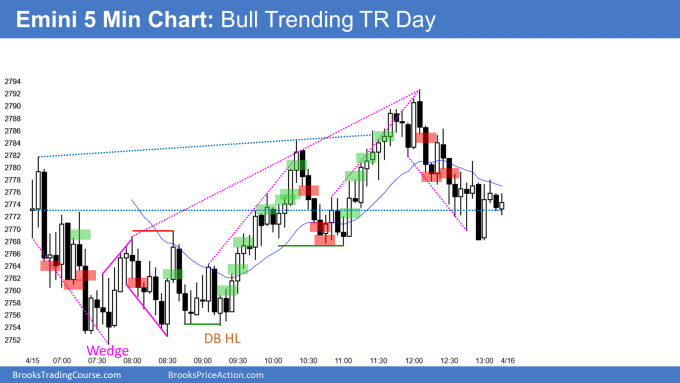
Here are several reasonable stop entry setups for today. I show each buy entry with a green rectangle and each sell entry with a red rectangle. I rarely also show limit order entries and entries on the close of bars. Buyers of the Brooks Trading Course and Encyclopedia of Chart Patterns have access to a much more detailed explanation of the swing trades for each day (see Online Course/BTC Daily Setups).
My goal with these charts is to present an Always In perspective. If a trader was trying to be Always In or nearly Always In a position all day, and he was not currently in the market, these entries would be logical times for him to enter.
If the risk is too big for your account, you should wait for trades with less risk or trade an alternative market like the Micro Emini.
End of day summary
Today gapped down and formed a 1 day island top on the daily chart. On the 5 minute chart, today was a trading range day. After a weak selloff on the open, the Emini went sideways. It reversed up but failed just below yesterday’s low. The day closed in the middle. It is a weak buy signal bar on the daily chart for tomorrow.
Traders should expect a test of the April 1 low by the end of May. It could come in April. They are deciding if today’s gap down after a 2 week wedge rally is the start of a 2 – 3 week test down.
Since the rally got near the 50 day simple moving average, it will probably have to get there before the selloff begins. It can reach it by going sideways or a little more up.
The bears need follow-through selling over the next few days to convince traders that they have regained control. If they do not get it, the odds will continue to favor at least slightly higher prices before the test of the April 1 low.
See the weekly update for a discussion of the price action on the weekly chart and for what to expect going into next week.
Trading Room
Traders can see the end of the day bar-by-bar price action report by signing up for free at BrooksPriceAction.com. I talk about the detailed S&P Emini futures price action real-time throughout the day in the BrooksPriceAction.com trading room. We offer a 2 day free trial.
Charts use Pacific Standard Time
When I mention time, it is USA Pacific Standard Time (the Emini day session opens at 6:30 am PST, and closes at 1:15 pm PST). You can read background information on the intraday market reports on the Market Update page.