Trading Update: Tuesday February 8, 2022
Emini pre-open market analysis
Emini daily chart
- The bears got an inside bar yesterday on the daily chart, making the market more neutral.
- The bulls have a high 1 buy above yesterday’s high. However, the signal bar is a bear bar in tight trading range and a four bar bear micro channel.
- The bears see a breakout pullback short below yesterday’s low, but it is forcing bears to sell at the bottom of a likely pullback for the bulls.
- After the four consecutive bull bars last week, the odds are the Emini will have a rally for a few days testing the high of last week.
- The bears are hopeful they can turn the market back down after a test of last week’s high. This would create a double top or a wedge top (January 26, February 2) and give the bears a reasonable chance at a short setup.
- The market is very close to 50%-50% for both the bulls and the bears. The market is deciding between testing the January lows or the all-time high.
- The Emini on the daily chart is clearly in a trading range, and the price is in the middle of the range from the October 2021 lows to the low of January 2022. The middle of any trading range is a bad area to initiate long or short positions, so it is better for most traders to wait for more clarity.
Emini 5-minute chart and what to expect today
- Emini is down 12 points in the overnight Globex session.
- The market will probably have a trading range open and test either the high or low of yesterday.
- The market has already tested yesterday’s low during the early hours of the Globex session, so the market may have to test yesterday’s high as well.
- Traders should expect limit order trading on the open and wait for either a strong breakout with follow-through or wait for a credible stop entry for a swing.
Yesterday’s Emini setups

Al created the SP500 Emini charts.
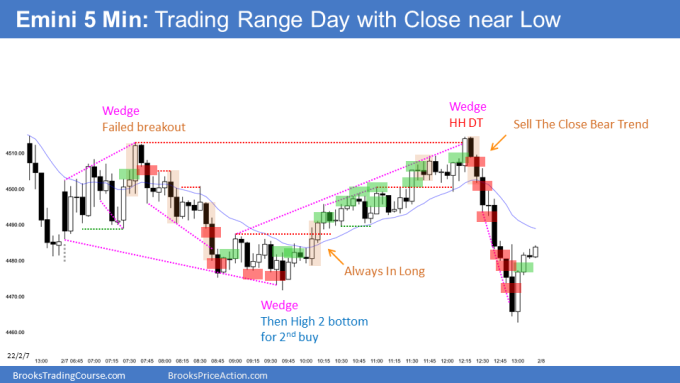
Here are several reasonable stop entry setups from yesterday. I show each buy entry with a green rectangle and each sell entry with a red rectangle. Buyers of both the Brooks Trading Course and Encyclopedia of Chart Patterns have access to a much more detailed explanation of the swing trades for each day (see Online Course/BTC Daily Setups).
My goal with these charts is to present an Always In perspective. If a trader was trying to be Always In or nearly Always In a position all day, and he was not currently in the market, these entries would be logical times for him to enter. These therefore are swing entries.
It is important to understand that most swing setups do not lead to swing trades. As soon as traders are disappointed, many exit. Those who exit prefer to get out with a small profit (scalp), but often have to exit with a small loss.
If the risk is too big for your account, you should wait for trades with less risk or trade an alternative market like the Micro Emini.
EURUSD Forex market trading strategies
EURUSD Forex daily chart

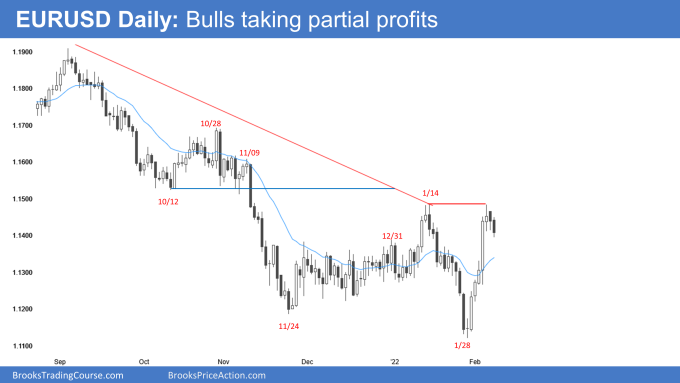
- The market went below yesterday’s bar this morning on the daily chart.
- After five consecutive bull bars, the odds are the market will get the 2nd leg up that will probably test above last week’s high.
- The bulls see the market either in a bull trend or a trading range. The bulls will buy every pullback expecting higher prices soon and a test of the October 2021 low, followed by the August 2021 low.
- While the market is always in long, it still has not broken strongly above the January high. This means the market still may be in a trading range, and the bulls could have a much deeper pullback than they would like. Is the current pullback below yesterday likely to lead to a deep retracement of last week’s bull rally? Probably not, but if the bears can get a 2nd entry short, there would be a increased risk of a deeper retracement of last week’s rally.
- At this moment, the odds are that the market will break above the January high. However, the bulls’ problem is that their risk is big, and their risk-reward is not great. This means that the bulls will be very quick to get out and will not let their stop hit below the January lows.
- My point in bringing up the above is that if the market goes sideways around the January high, more and more bulls may think the probability of the upside breakout does not justify the large risk. Those bulls would exit and look to buy lower. This means there might be a deeper retracement of last week’s rally than what traders want.
- Most traders will likely view the past two days as bulls taking partial profits more than bears selling betting on the double top.
Summary of today’s S&P Emini futures price action and what to expect tomorrow

Al created the SP500 Emini charts.
End of day summary
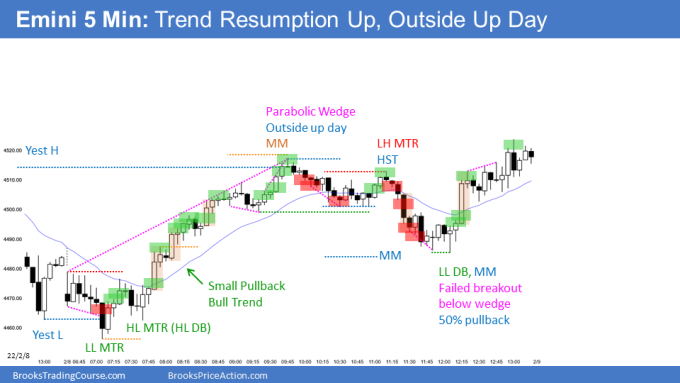
- The emini formed a Head and Shoulders bottom (higher low major trend reversal) within the first hour of the day.
- By 7:55 (bar 17), the market was Always In Long and likely going higher, and traders would begin looking for areas of resistance for profit targets, such as the measured move of the past four consecutive bull bars.
- The market had consecutive buy climaxes (parabolic wedge) leading to the high of the day, followed by 10 bars and two legs sideways to down.
- At 11:10 (bar 56), the market formed a Head and Shoulders Top (lower high major trend reversal) that led to a 50% pullback.
- 12:05 (Bar 67), the bulls had a failed bear breakout below a wedge bottom leading to a strong upside breakout and a rally into the close.
- Today triggered the high one buy on the daily chart; however the 4 bar tight trading range lowers the probability for the bulls.
See the weekly update for a discussion of the price action on the weekly chart and for what to expect going into next week.
Trading Room
Traders can see the end of the day bar-by-bar price action report by signing up for free at BrooksPriceAction.com. I talk about the detailed S&P Emini futures price action real-time throughout the day in the BrooksPriceAction.com on trading room days. We offer a 2 day free trial.
Charts use Pacific Time
When I mention time, it is USA Pacific Time. The Emini day session charts begin at 6:30 am PT and end at 1:15 pm PT which is 15 minutes after the NYSE closes. You can read background information on the market reports on the Market Update page.
Hi Brad, I and certainly many other traders are very grateful to your daily detailed preview and the end of day summary. Much appreciated and I am looking forward to each new one.
You see more than I and your analysis gets me seeing more and more as time goes by.
You are often referencing times like “At 11:10” when something happened which is great in general but requires a time calculation if being in a different timezone.
Would it be possible to add a bar count to this like “At 11:10 B57”? Everyone with bar counts on their chart can then quickly see which area on the chart you are referring to.
That is a good point and I did not consider that. I will start using bar counting more often.
Brad thanks for the report. How likely is it possible to add a daily chart to the daily report as everyday there is a reference to it?
Hi Eli,
Brad and Al already have a lot of work putting these reports together. So although a good idea in principle, it would be adding extra work for something that traders should have easily available on their own device, right?
You can study the daily chart and 5-minute charts before reports are issued at 6:20am PT, as part of your prep.