Emini and Forex Trading Update:
Monday April 5, 2021
Pre-Open market analysis of daily chart
- Friday finally broke above 4000 Big Round Number, and closed on its high, above 4,000.
- Emini went sideways for several days to a couple weeks at every prior Big Round Number since 3,500. Traders expect sideways for at least a few days, but could continue to rally for a week first.
- This is only the 4th multiple of 1,000 in the 100-year history of the S&P so this is a rare event.
- Thursday gapped up, which means there is a small gap on the monthly chart. Small gaps usually close before the bar closes, and therefore the gap should close this month. If not, then probably within a few months.
- Buy climaxes on daily, weekly, and monthly charts, but no top. Traders will continue to expect higher prices until strong reversal down.
- Streak of 6 consecutive bull bars on daily is unusual, and therefore unsustainable, and climactic. Increased chance of bear bar today or soon.
- Most days for several weeks have had at least one swing up, and one swing down, so that is likely today.
- Since market is at such an unusual Big Round Number, increased chance of surprisingly big move up or down. Remember, there are only 3 other data points (1,000, 2,000, and 3,000) in the history of the stock market, so not enough to have an opinion about what will happen based on the multiple of 1,000 alone. But bull trend, so higher prices likely.
- Today will probably gap up on both the daily and weekly charts.
- Since extreme buy climax on both charts, increased chance of 2 or 3 sideways days. Bears will want gap down and island top. Bulls will want bull flag and resumption of strong bull trend.
Overnight Emini Globex trading on 5-minute chart
- Up 26 points in Globex market so will have big gap up today.
- Big gap increases chance of trend day in either direction.
- If there is a trend, up is more likely than down.
- If there is series of strong trend bars up or down in 1st hour, then increased chance of trend day.
- Most days have trading range open for 1st hour or two. That is most likely today.
- Most days have at least one swing up and one swing down.
Thursday’s Emini setups


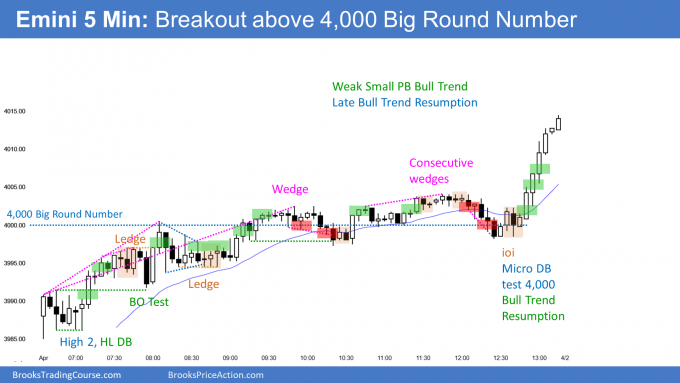
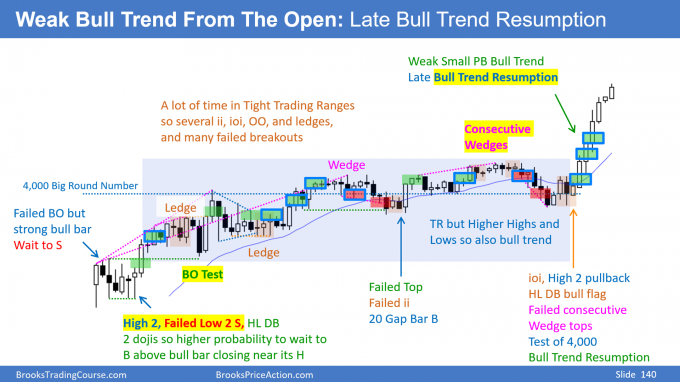
Here are several reasonable stop entry setups from last Thursday (pre-Good Friday holiday). I show each buy entry with a green rectangle and each sell entry with a red rectangle. Buyers of both the Brooks Trading Course and Encyclopedia of Chart Patterns have access to a much more detailed explanation of the swing trades for each day (see Online Course/BTC Daily Setups).
My goal with these charts is to present an Always In perspective. If a trader was trying to be Always In or nearly Always In a position all day, and he was not currently in the market, these entries would be logical times for him to enter.
If the risk is too big for your account, you should wait for trades with less risk or trade an alternative market like the Micro Emini.
EURUSD Forex market trading strategies
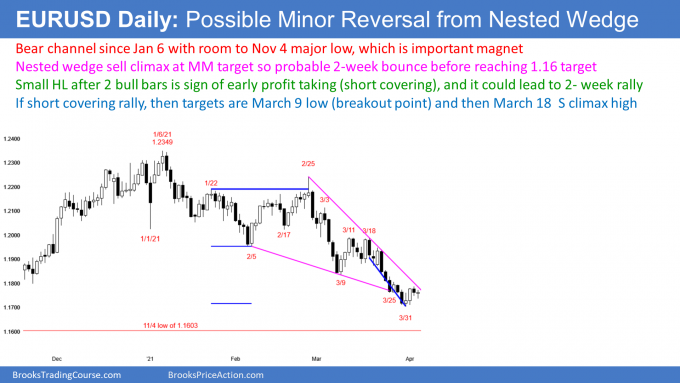
EURUSD Forex daily chart

- Strong bear trend.
- Today triggered Low 1 bear flag sell signal by going below Friday’s low.
- Target below is November 4 low, which is start of final leg up of wedge top on weekly chart.
- Possible wedge bottom, so might get 2-week short covering rally.
- Bulls hope today will be small higher low and start of rally.
- Targets for bulls are March 9 low, which is the most recent breakout point, and then the March 9 high, which is the start of the most recent sell climax.
Overnight EURUSD Forex trading on 5-minute chart
- Fell below yesterday’s low, which triggered Low 1 sell signal on daily chart.
- Reversed up strongly from Expanding Triangle bottom.
- Rally has been strong enough for traders to expect at least a small 2nd leg sideways to up.
- Bulls want bull trend to last all day. They would like today to break above Friday’s high, and become an outside up day. They also want today to close on the high.
- Day traders have only been buying of the past couple hours.
- They will continue to only buy until there is at least a 20-pip selloff.
- If there is a 20-pip selloff, a trading range will be more likely than a bear trend.
- Bulls will buy pullbacks, and then bears will sell reversals down from new highs for scalps.
- Since this is possible start of 2-week rally, some bulls will look to hold part of their position for a leg up on the daily chart.
Summary of today’s S&P Emini futures price action and what to expect tomorrow

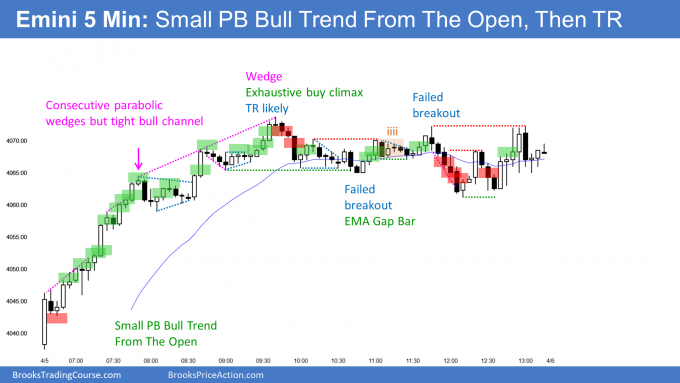
Here are several reasonable stop entry setups for today. I show each buy entry with a green rectangle and each sell entry with a red rectangle. Buyers of both the Brooks Trading Course and Encyclopedia of Chart Patterns have access to a much more detailed explanation of the swing trades for each day (see Online Course/BTC Daily Setups).
My goal with these charts is to present an Always In perspective. If a trader was trying to be Always In or nearly Always In a position all day, and he was not currently in the market, these entries would be logical times for him to enter.
If the risk is too big for your account, you should wait for trades with less risk or trade an alternative market like the Micro Emini.
End of day summary
- Gap up to new all-time high on daily and weekly charts.
- Strong Bull Trend From The Open.
- Since there were many early big bull bars with not much of a pause, bulls were probably going to become exhausted. That made a trading range likely.
- Wedge top and midday trend reversal.
- Lower higher major trend reversal and head and shoulders top, but continue in trading range instead of reversing into bear trend.
- For tomorrow, bulls want trend resumption up and bears want trend reversal down.
- Tomorrow will probably have at least one swing up and one swing down after today’s buy climax and trading range.
- Buy climax is getting extreme. That increases chance of profit taking for a couple days, but bulls will buy the first pullback,
See the weekly update for a discussion of the price action on the weekly chart and for what to expect going into next week.
Trading Room
Traders can see the end of the day bar-by-bar price action report by signing up for free at BrooksPriceAction.com. I talk about the detailed S&P Emini futures price action real-time throughout the day in the BrooksPriceAction.com trading room. We offer a 2 day free trial.
Charts use Pacific Time
When I mention time, it is USA Pacific Time (the Emini day session opens at 6:30 am PT, and closes at 1:15 pm PT). You can read background information on the intraday market reports on the Market Update page.
I thinking abit ahead to know my options when we eventually get the blow off top.
I remember you use a etf opposite to the SPY and I can’t remember which it is. However the most important part of my questions (name of etf is 1) is that I never got your reason for using a negative 3x leverage to compare to spy which (I assume?) is 1 to 1. I look at several “reverse spy) and they are mostly leveraged.
To much explaining… I wonder short explained, the name of the etf(n?) and why you use a 3x leveraged one (as said i get that there is fewer etf reversed and most is leveraged. Is there some advantages with the one you use than maybe one that have 2x leverage (i have not found any which is 1 to 1 like spy. I may be a bad researcher, but limited access to information as eu does not let us buy etfs (but we can do options! Nice to know they really care about our risk! ) however I can buy us etf in Norway.
I made it to long. I just need a very short answer..
Just to answer your first question, SH is the -1X inverse SPY fund you might be looking for? I think Al often uses SDS (with a -2X) for illustration.
https://www.etf.com/ has some nice filters to find ETFs like this.
I still sometimes trade the SPY and QQQ, and I also sometimes sell or buy the Emini for trades lasting days to weeks.
As for any ETF, I only trade them if they have big volume. What is big? Maybe 5 million shares a day, maybe at least 20,000 shares per an 5 minute bar.
The SPXU is an example, and the TQQQ is a 3x inverse QQQ. I also sometimes trade the UVXY as an alternative to a 3x inverse SPY, even though it is based on the VIX. However, it now is only trading at 5.00 and that makes the bid/ask spread too big. I will wait until it is back up to 20 or so.
There are many other 2x and 3x leveraged ETFs and inverse ETFs that meet my criteria. I don’t need the leverage, but if the volume is good for the ETF, I will trade it. As a trader, my general rule is to tie up as few dollars as possible. That is a philosophical issue and not a practical one because I rarely risk more than 1% of my trading accounts on any trade.
Interesting that the index most representative of the real economy, the Russell 2000, was the weakest today.
This was rotation back to growth from value, which is the opposite of the past couple months. It represents an increase in confidence, but it will probably lead to a blow-off top. The year might make its high before the end of May.
Hi Al,
How often does a day have a huge opening bar? And does that bar often indicate a bull or bear trend day? Thanks!
Daniel
The 1st bar is either the high or low of the day 20% of the time, whether or not the day is a strong trend day.
20% of days are Trend From The Open Days, but not necessarily from the 1st bar. Most either begin with a strong trend bar or there is a strong trend bar in the first 5 bars or so.
These 2 statistics of 20% usually but not always are the same days.
Hi, Daniel!
Like Al said, just 20% are days with strong trend from the open, therefore no matter how a strong BO on the open is, 80% chance the there will be at least a minor reversal and 50% chance there’ll be a major reversal.
Thanks Filipe