Emini endless pullback from parabolic wedge buy climax
I will update again at the end of the day.
Pre-Open market analysis
As I said before yesterday’s open, there is a parabolic wedge buy climax on the daily chart. It most often leads to an Endless Pullback. This is a small bull flag that keeps adding bars, but the bull trend does not resume. That is what is likely here over the next 2 weeks. It is typically just a tight trading range that tilts down.
If the bulls do get one more new high this week, traders will probably sell it. Despite the strong rally over the past 4 weeks, the bulls are now exhausted. Risk managers will insist on traders reducing their longs. The result is usually a 2 week pullback.
Can the bears get a strong reversal down? Yes, but when a bull trend has been as strong as the current one, the 1st leg down is typically either brief or shallow. Traders should expect sideways to down price action for a couple weeks.
Overnight Emini Globex trading
The Emini is up 10 points in the Globex session. This is a continuation of yesterday’s bull breakout above the bear channel. However, because of the buy climax, the odds are that the Emini will be mostly sideways to down for a couple weeks.
When that is the case, there is typically a lot of trading range price action intraday. There are usually more limit order entries and fewer stop order entries. However, the legs up and down are big enough for swing trades, and there still will be many good stop order trades every day.
Yesterday’s setups

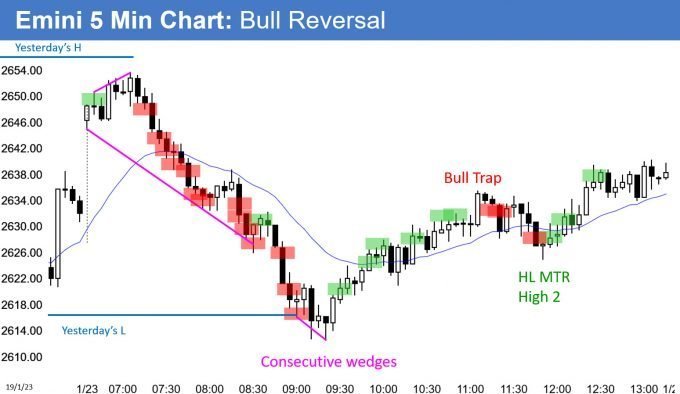
Here are several reasonable stop entry setups from yesterday. I show each buy entry with a green rectangle and each sell entry with a red rectangle. I rarely also show limit order entries and entries on the close of bars. My goal with these charts is to present an Always In perspective. If a trader was trying to be Always In or nearly Always In a position all day, and he was not currently in the market, these entries would be logical times for him to enter.
EURUSD Forex chart waiting for Brexit catalyst before breaking out

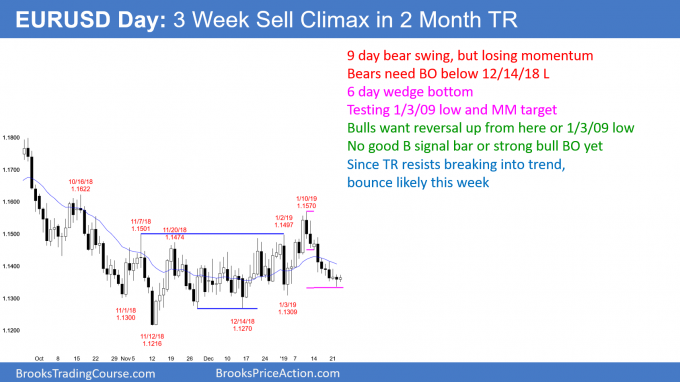
The EURUSD daily Forex chart sold off for 3 weeks after breaking above the 3 month trading range. There are higher lows and highs since November, which is a 3 month bull channel. However, it is within a yearlong bear channel. Finally, it is in the middle of a 3 month trading range. The chart is in Breakout Mode.
Over the past 7 days, the bars have become small. In addition, there is a lot of overlap. Finally, there is a 6 day micro wedge bottom. These are signs that the selloff is losing momentum and awaiting information. Brexit is a potential major catalyst for a successful breakout up or down from the 3 month trading range.
Overnight EURUSD Forex trading
Because the past 6 days have been trading range days, today will likely be mostly sideways again. The EURUSD 5 minute chart has been in a 25 pip range overnight. Day traders will continue to scalp, waiting for a strong breakout up or down. Since there is no bottom yet, the odds are that the selloff will reach the January 3 low around 1.13 within 2 weeks.
Summary of today’s S&P Emini futures price action and what to expect tomorrow

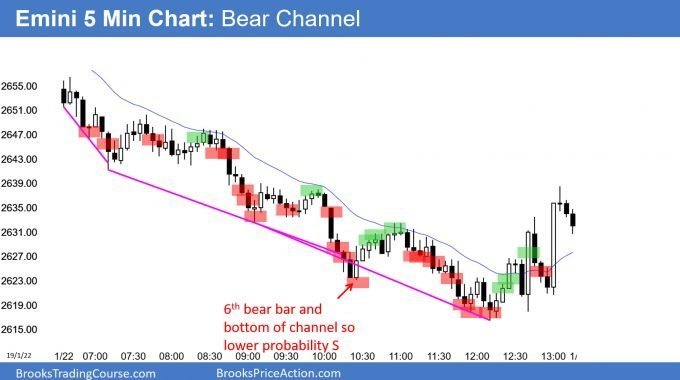
Here are several reasonable stop entry setups for today. I show each buy entry with a green rectangle and each sell entry with a red rectangle. I rarely also show limit order entries and entries on the close of bars. My goal with these charts is to present an Always In perspective. If a trader was trying to be Always In or nearly Always In a position all day, and he was not currently in the market, these entries would be logical times for him to enter.
End of day summary
The Emini sold off strongly from just below yesterday’s high. It reversed up from below yesterday’s low closed in the middle of the range. This is consistent with a sideways to down move after the parabolic wedge rally on the daily chart. There will probably be many mostly sideways days over the next 2 weeks after the exhaustive buy climax.
See the weekly update for a discussion of the price action on the weekly chart and for what to expect going into next week.
Trading Room
Traders can see the end of the day bar-by-bar price action report by signing up for free at BrooksPriceAction.com. I talk about the detailed S&P Emini futures price action real-time throughout the day in the BrooksPriceAction.com trading room. We offer a 2 day free trial.
Charts use Pacific Standard Time
When I mention time, it is USA Pacific Standard Time (the Emini day session opens at 6:30 am PST, and closes at 1:15 pm PST). You can read background information on the intraday market reports on the Intraday Market Update page.
Al, I feel there is big gap correctly reading PA between traders, due luck of underestimation of higher time frame.
Like today tight channel down, could easily be viewed selling (bull flag H2-PB-as trader Richard did). But if you pay attention to higher time frame-daily chart you would be much more inclined to closed if entered short.
But at the same time you say that trader does not need to look at the other timeframe in order to be profitable.
I am trying to say it feels its the higher time frame, which gives the edge in 50 % market.
I agree that higher time frames can be useful, but they do not offer many signals to day traders. Conventional wisdom tells traders to look for the big picture on a higher time frame and then a signal on a smaller time frame. Because it sounds too good to be true, it is not true. It is a false god.
All that a day trader needs is one chart. He can choose the chart and just look for setups. I see 40 – 50 reasonable trades a day on the 5 minute chart. The patterns, support, and resistance are more important than those on the higher time frames.
Information from a higher time frame can give additional information, but as a day trader, it is not as important as the chart I am trading. It is rarely useful and it is better to ignore it. It can be a distraction and a convenient, rational excuse to not work hard at seeing what is on the 5 minute chart. But, it is an excuse, usually based in fear.
If a trader focuses on a single time frame, he will see amazing things, and they will always be more important than anything happening on any other time frame. If there truly is support or resistance on a higher time frame, the 5 minute chart will react in a way that tells you it is there. I don’t need to see the other chart. I just need to see what the 5 minute chart is doing. I don’t care if reversals and breakouts on the 5 minute chart are also on a higher time frame. I am only going to trade my one chart. Anything more is an emotional crutch and an excuse to avoid analyzing or being unable to analyze what is in front of me.
Thank you Al,
I did not mean my coment towards making decisons towards taking actual trades on daily, but more towards
understanding overall price context,
I asked you about short entry on 5 min chart, which triggered on 10th of January 2019/bar 5 ( your reply below)
The daily chart was clearly the chart, which made you to wait and not to take a trade, even that
we had a sell reason on 5 min.
sorry do not mean to be picky, just clear.
thx
Jiri Hovora says
January 10, 2019 at 1:57 pm
Hi Al, bear bar 4. Was there reason why not to sell below? thx
Al Brooks says
January 10, 2019 at 3:30 pm
It was a short, but coming into the day, there was a decent chance of an outside up day.
The daily chart has been strong, yesterday was a doji and therefore a weak sell signal bar,
yesterday’s range was small, and the November low is a magnet above.
Unless the selling is dramatically strong, I don’t want to sell that far below the average price.
The odds favored an early reversal up.
Jiri Hovora says
January 10, 2019 at 7:27 pm
thank you
Thank you Al
Al, I sold 1 contract below 63, expecting sellers above to at least break even. I used a wide stop to above yesterday’s high. I sold a second contract at 2631.25 for a possible DT bear flag 62. Never got a chance to break even. With all the limit order trading this afternoon, I expected a reversal down, so I used the 4 unit scale in from the trading course, selling 2 at 2636 on bar 73. Obviously the trade was a looser with no chance for even break even. I am allowed 56 point risk per trade, so the trade didn’t destroy me, it just ruined my day. How could I have managed it better?
I agree with your view of a limit order market. When I think that is the case, I am looking to buy low, sell high, scale in, and scalp. Generally, if the market has been mostly up for about 10 bars, I prefer to only look to sell. If it is down, I only look to buy. Therefore, I would rather look to buy around bar 63 and buy more lower.
I think selling 63 makes sense if a trader was thinking the bear trend on the open was resuming. I talked about that possibility in the room, but said that the bears needed more than 63. Had I sold below 63 for a swing, I would have exited above 64.
Even though it was only a small bull doji, it was the 1st reasonable candidate for a major trend reversal after the rally to 55. It was also a High 2 bull flag. If the bears then quickly formed a credible bear flag, I could have sold again.
Unless a trading range day clearly becomes a trend, I assume the trading range trading is still in effect. I therefore will only buy low and sell high. Trading ranges often have strong legs up and down that need just 1 – 2 more bars to clearly become trends. Most of the time, they reverse and do not create that needed additional bar. The bull trap at 55 is another example.
Richard – I know it is none of my business how you trade. But I could not help but say something in hopes of saving you a lot of time, frustration, and money.
What you are doing (in my opinion) is very dangerous. Just because you can risk 56 points on a trade, doesn’t mean you should. Let alone on a trade in hopes of breaking even on the first or making a small profit (essentially a scalp). It seems like you are trading out of hope and fear. You probably did not sell at all during the strong sell off due to fear, then entering a position in hopes of getting out break even. This can be extremely costly. I know from experience.
I am not saying you should not use a wide stop and scale in. But if you are going to do so, at least start with an edge (reasonable stop order trade). Then scale in both when prices go strongly in your favor, and when they go against you. You will have a much better chance of actually getting out break even on the first trade than if you start with a limit order entry.
For example; selling 56 and scaling in higher. Look how prices came back and tested the entry yesterday and this morning. Also see how prices tested the 43 sell but could not reach the entry price, trapping the bears on 64 (around where you sold). There are countless examples of this everyday; see for yourself.
**It is also very important to press trades that are going in your favor. Otherwise you are risking a lot on losing trades (lower probability), and not maximizing your profit when you are in a good one (probability is in your favor).
“Those who lose consistently, play to avoid a loss.”
“Those who consistently make a profit, play to win”
I in no way mean this to discourage you, but hope it helps provide some insight and betters your odds for success.
Good luck on your trading journey,
Josh