Emini and Forex Trading Update:
Friday May 15, 2020
I will update again at the end of the day.
Pre-Open market analysis
The Emini reversed up yesterday after breaking below the May 4 low. That is the neckline of the 3 week double top. Yesterday is now a High 2 bull flag buy signal bar for today. The bulls want the rally to continue up to the 200 day moving average and the 3000 Big Round Number.
But if today is anything less than a strong bull day, traders will expect a 2nd leg down. If they get the start of a 2nd leg down within the next few days, they will then look for a selloff to 2600 in May or June.
Today is Friday so the weekly chart is important. This week is an outside down week. There is now a micro double top at the 20 week EMA, which is a reflection of the double top on the daily chart.
If the bears can get the week to close below last week’s low, traders will expect a 2 – 3 week selloff to 2600. If the week closes well above last week’s low, the bulls will try to continue the bull trend up to 3000.
Overnight Emini Globex trading
The Emini is down 30 points in the Globex session. Yesterday formed a bull channel on the 5 minute chart. A bull channel is a bear flag because traders know that there is usually a bear breakout and then a transition into a trading range.
That increases the chance of a lot of trading range price action today. But yesterday’s range was big. Even if today is a trading range day, there should be at least one swing up and one swing down.
The Emini is in the middle of the week’s range. It might not be able to reach the top or bottom of the range today. When that is the case, it often pays attention to the middle, which is 2850. If the bulls can get the week to close above the midpoint, it would be a sign that they won the week. A close below the midpoint is a sign that the bears were a little stronger.
Yesterday’s setups

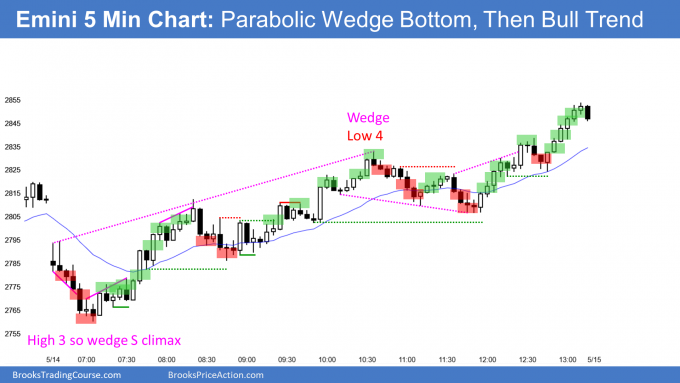
Here are several reasonable stop entry setups from yesterday. I show each buy entry with a green rectangle and each sell entry with a red rectangle. I rarely also show limit order entries and entries on the close of bars. I do not want the lines to be distracting. If they are longer, I make them dotted. But, they have to be visible, so I make the shorter ones solid. Buyers of the Brooks Trading Course and Encyclopedia of Chart Patterns have access to a much more detailed explanation of the swing trades for each day (see Online Course/BTC Daily Setups).
My goal with these charts is to present an Always In perspective. If a trader was trying to be Always In or nearly Always In a position all day, and he was not currently in the market, these entries would be logical times for him to enter.
If the risk is too big for your account, you should wait for trades with less risk or trade an alternative market like the Micro Emini.
EURUSD Forex market trading strategies

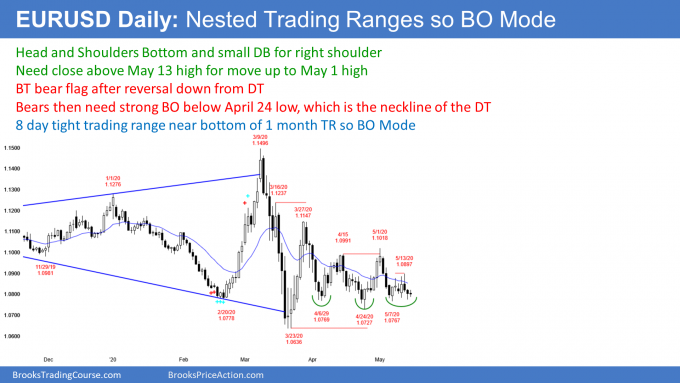
The EURUSD Forex market on the daily chart is deciding on the direction of its next move. It has been in a tight trading range with small ranges for 8 days. That range in near the bottom of a month-long range, which is nested in an 8 month range.
Every trading range always has both buy and sell setups. The bulls have a head and shoulders bottom. The right shoulder is a small double bottom. There is a April/May double top and a 4 day double top bear flag.
Traders believe that the current price is just above right. There is no energy to change it.
But, the price of any financial market does not stay in a tight range forever. Traders expect a breakout soon. But, in what direction? The market could not be in such a tight range if either the bulls or bears had an advantage.
This is a Breakout Mode pattern. There is a 50% chance of a breakout up or down. While waiting for the breakout, day traders are just looking to scalp small reversals up and down.
Overnight EURUSD Forex trading
The 5 minute chart of the EURUSD Forex market has been in a 50 pip range overnight. Today’s low is above yesterday’s low. It just broke above yesterday’s high in the past 10 minutes. The bulls hope that the 50 pip rally is the start of a bull trend day.
Today is Friday so support and resistance on the weekly chart are important. This brief rally is stalling at the open of the week. It’s purpose might be simply to convert the candlestick on the weekly chart to a doji bar from a bear bar.
Day traders have been disappointed by moves up and down for 2 weeks and they have been taking quick profits. If the bulls can get a few more bull trend bars, they will hold onto their longs for a swing up today. If the follow-through is bad over the next few bars, they bulls will scalp out and the bears will sell for a scalp down.
Summary of today’s S&P Emini futures price action and what to expect tomorrow

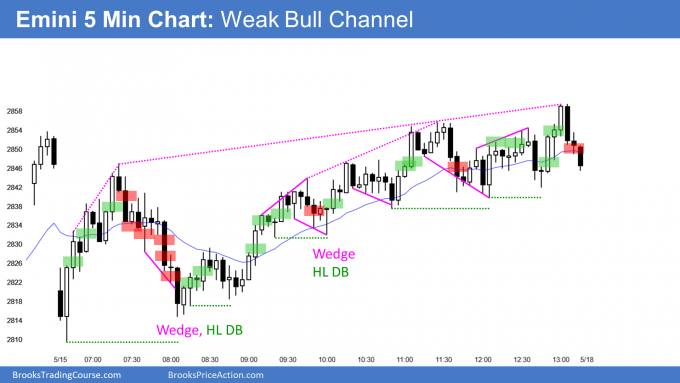
Here are several reasonable stop entry setups for today. I show each buy entry with a green rectangle and each sell entry with a red rectangle. I rarely also show limit order entries and entries on the close of bars. I do not want the lines to be distracting. If they are longer, I make them dotted. But, they have to be visible, so I make the shorter ones solid. Buyers of the Brooks Trading Course and Encyclopedia of Chart Patterns have access to a much more detailed explanation of the swing trades for each day (see Online Course/BTC Daily Setups).
My goal with these charts is to present an Always In perspective. If a trader was trying to be Always In or nearly Always In a position all day, and he was not currently in the market, these entries would be logical times for him to enter.
If the risk is too big for your account, you should wait for trades with less risk or trade an alternative market like the Micro Emini.
End of day summary
The Emini formed a trading range day today. It closed almost exactly in the middle of the week’s range. The bulls want a reversal up from a double bottom with the May 4 low. They then want the rally to continue up to the 200 day moving average and the 3000 Big Round Number. However, the bears want this week’s selloff to be the start of a bear leg down to 2600.
Traders need more information. If there are big bull days early next week, the bulls will probably reach their goal. But if there is a reversal down from a lower high, the selloff should reach 2600 in May or June.
See the weekly update for a discussion of the price action on the weekly chart and for what to expect going into next week.
Trading Room
Traders can see the end of the day bar-by-bar price action report by signing up for free at BrooksPriceAction.com. I talk about the detailed S&P Emini futures price action real-time throughout the day in the BrooksPriceAction.com trading room. We offer a 2 day free trial.
Charts use Pacific Standard Time
When I mention time, it is USA Pacific Standard Time (the Emini day session opens at 6:30 am PST, and closes at 1:15 pm PST). You can read background information on the intraday market reports on the Market Update page.
Is there a way to get a copy of the code that puts numbers on the bars? There seem to be a lot of things that happen around certain bars and I would like to have the reminders on my screen.
For example: Bar 12-18 usually the high or low of the day has been put in.
It would also be nice to know when the higher time from hourly bar closes.
I believe there were a couple of other ones I had in my notes but I can’t remember off the top of my head.
I used an indicator that I wrote for years, but a trader in the chatroom created another that I like better and I have used that for several years. However, he requested that I do not share the code.
I just checked to see if I still had the old indicator and I do not. I believe I posted it on this site several years ago, but I don’t remember where. I hope someone reads this and can post it again here.
i think this is it? Indicator Code
Al, I had a profitable day; yet, I gave back some on selling below Bar 74. The doji bars and their tails on top preceding Bar 74 seemed like weak follow through from the Bull Outside Reversal bar 67. If you have time, what is your more specific reason for not taking the sell below Bar 74?
David,
Nice work on being profitable!!! For each bar there is the potential to buy above or sell below. The sell in this case would have been below bar 73 as prices descended on bar 74. When bar 74 closed there was the potential that the totality of the move had already occurred since it approached a previous area when buying had begun bar 61 (trading range days do this).
Hi David,
Eric brought up some good points. Another reason to avoid going short was the 2850 price level above, which as Al mentioned to pay attention to today since it was a midpoint price for the week. It acted as a magnet through most of the day. Also the bull channel kept on creating higher lows all day, even with fairly decent bear bars and bull bars with tails. With so little room to the trend line, I think 74 was more likely to be a bear trap than a successful BO that would lead to a major reversal.