Emini and Forex Trading Update:
Friday August 21, 2020
I will update again at the end of the day.
Pre-Open market analysis
The Emini has been in a Small Pullback Bull Trend since June. Yesterday was another brief pullback. It is a buy signal bar for today.
However, the dominant feature on the daily chart is the streak of 9 consecutive bull bars that ended last week. That is an extreme buy climax. Traders should expect a 200 point drop to the bottom of that streak before the Emini goes much higher. The reversal down might have begun on Wednesday, but there could be one more brief new high first.
Today is the last day of the week. If the week closes on its low, traders will expect lower prices. Even if it simply closes below the open of the week, the bear body would be enough to increase the chance of at least sideways to down trading next week.
If the week closes on the high, the Emini might go a little higher before retracing the 9 consecutive bull bars. The reversal down should begin by the end of the month. It might have begun this week.
Overnight Emini Globex trading
The Emini is down 14 points in the Globex session. Yesterday was a Spike and Channel Bull Trend. Traders should think of a bull channel as a bear flag because there is a 75% chance of a break below the bull trend line.
A channel usually evolves into a trading range. Therefore, there is an increased chance that today will be a trading range day. Since it will open with yesterday’s range and yesterday’s range was big, today could be an inside day. It would then be both a buy and sell signal bar for next week.
Can today be a 2nd big bull day? Of course. However, there is probably little left to the rally on the daily chart near-term after the streak of 9 consecutive bull days ended last week.
Can it be a huge bear day? This week would then close on the low and be a strong sell signal bar for next week.
More likely, it will have at least one swing up and one swing down and be mostly a trading range day. It could stay around the open of the week today because it has oscillated around the open all week and today is Friday. Then, in the final hour, traders will decide if the week will have a bull or bear body on the weekly chart. Either way, the Emini should begin to trend down soon for at least a couple weeks.
Yesterday’s setups

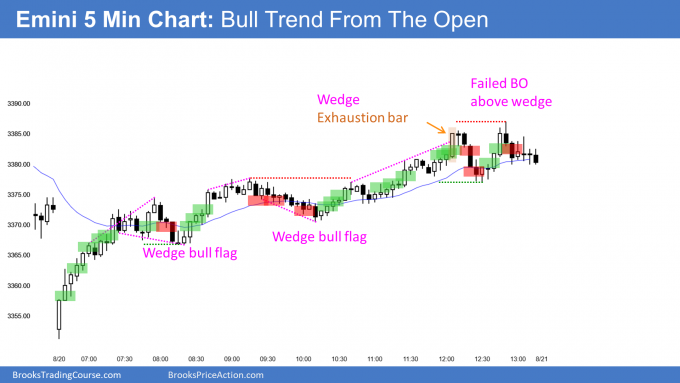
Here are several reasonable stop entry setups from yesterday. I show each buy entry with a green rectangle and each sell entry with a red rectangle. I rarely also show limit order entries and entries on the close of bars. I do not want the lines to be distracting. If they are longer, I make them dotted. But, they have to be visible, so I make the shorter ones solid. Buyers of the Brooks Trading Course and Encyclopedia of Chart Patterns have access to a much more detailed explanation of the swing trades for each day (see Online Course/BTC Daily Setups).
My goal with these charts is to present an Always In perspective. If a trader was trying to be Always In or nearly Always In a position all day, and he was not currently in the market, these entries would be logical times for him to enter.
If the risk is too big for your account, you should wait for trades with less risk or trade an alternative market like the Micro Emini.
EURUSD Forex market trading strategies

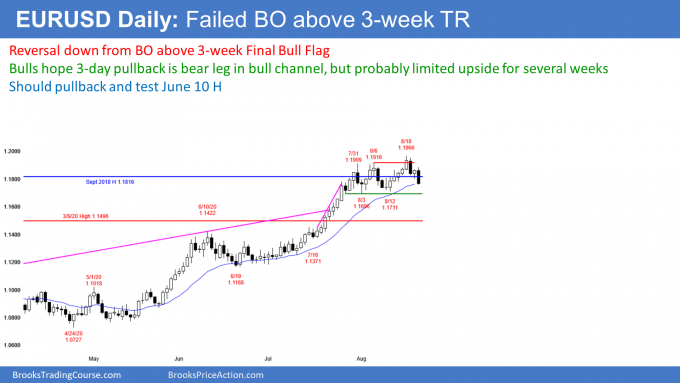
The EURUSD Forex market on the daily chart has been sideways for a few weeks. Since the trading range is late in a bull trend and the bull trend is a nested wedge, the trading range will probably be the Final Bull Flag.
The buy climax was so extreme that the bulls might be unwilling to buy aggressively again for several weeks. The pullback should test the breakout point of the March high and possibly the June 100 high. That means the selloff could retrace 500 pips.
Today traded above yesterday’s high and triggered a High 1 buy signal. However, the EURUSD then reversed down and it is now below yesterday’s low. This is an outside down day. If today closes below yesterday’s low, the EURUSD will then probably break below the bottom of the 3 week trading range next week.
Furthermore, if the week closes right around where it is, this week will be a sell signal bar on the weekly chart for a wedge buy climax at the resistance of the September 2018 high. After 8 consecutive bull bars on the weekly chart, traders should expect a pullback.
Overnight EURUSD Forex trading
The 5 minute chart of the EURUSD Forex market traded above yesterday’s high and then trended down overnight. Day traders have been selling for a swing down.
An outside down day often goes sideways around yesterday’s low. Consequently, today will likely begin to go sideways. If there is a 30 pip bounce, day traders will begin to buy reversals up for scalps. They will switch to scalping shorts from swing trading them.
The bears want today to close below yesterday’s low and on the low of the week. The more bearish they can the day and week look, the more traders will expect lower prices next week.
The bulls at a minimum will try to get today to close above yesterday’s low. They then would hope that next week would be sideways instead of down. They do not mind a pause in their 4 month bull trend. What they do not want is a 500 pip pullback.
Summary of today’s S&P Emini futures price action and what to expect tomorrow

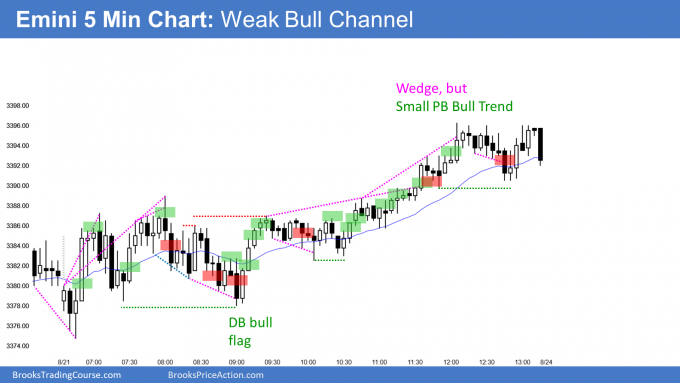
Here are several reasonable stop entry setups for today. I show each buy entry with a green rectangle and each sell entry with a red rectangle. I rarely also show limit order entries and entries on the close of bars. I do not want the lines to be distracting. If they are longer, I make them dotted. But, they have to be visible, so I make the shorter ones solid. Buyers of the Brooks Trading Course and Encyclopedia of Chart Patterns have access to a much more detailed explanation of the swing trades for each day (see Online Course/BTC Daily Setups).
My goal with these charts is to present an Always In perspective. If a trader was trying to be Always In or nearly Always In a position all day, and he was not currently in the market, these entries would be logical times for him to enter.
If the risk is too big for your account, you should wait for trades with less risk or trade an alternative market like the Micro Emini.
End of day summary
The Emini broke above yesterday’s high to trigger a High 1 bull flag buy signal on the daily chart. The Emini entered a trading range for several hours. It then rallied from a double bottom bull flag in the middle of the day to a new all-time high.
On the weekly chart, 4 of the past 7 bars gapped up, even though only one gap remained open. This week’s close on the high and the number of weekly gaps up increase the chance of another weekly gap up on Monday.
It is important to remember that a streak of 9 consecutive bull bars ended last week. Despite the strong weekly close, traders should still expect a reversal down to 3200 to begin by the end of the month.
See the weekly update for a discussion of the price action on the weekly chart and for what to expect going into next week.
Trading Room
Traders can see the end of the day bar-by-bar price action report by signing up for free at BrooksPriceAction.com. I talk about the detailed S&P Emini futures price action real-time throughout the day in the BrooksPriceAction.com trading room. We offer a 2 day free trial.
Charts use Pacific Standard Time
When I mention time, it is USA Pacific Standard Time (the Emini day session opens at 6:30 am PST, and closes at 1:15 pm PST). You can read background information on the intraday market reports on the Market Update page.
Hi Al,
Recently I am also trading Dow Jones futures with the techniques you teach. I noticed that yesterday Dows was quite strong that brought the US market up and reached open of the week. Did you have any study on the relationship between different index over your years of experience?
Long ago, I used to trade Dow futures. Nasdaq Futures, Russell Futures, and the S&P futures. I would watch all of the charts every day and pick the one with the best patterns.
It felt stressful and I could never convince myself that I was making more money trading like that.
They are all highly correlated and I do not think it matters which one a person traders. When I was trading Dow futures, the slippage was annoying and that was another factor that made me stop trading it. However, all experienced traders know that the correlation among those markets is so high that it does not matter which you trade.
This must be one of the strongest bull rallies of all time!
That’s what I was thinking. Keeps defying the probabilities it seems.
A 50% rally in 6 months is incredible!