Emini and Forex Trading Update:
Thursday June 18, 2020
I will update again at the end of the day.
Pre-Open market analysis
Yesterday was an inside day after a strong 2 day rally. It is therefore both a buy and sell signal bar for today. Since it had a bear body, it is a weak buy signal bar. There might be more sellers than buyers above.
Also, the rally was strong enough to make at least a small 2nd leg up likely. Therefore, there might be more buyers than sellers below.
The bulls want the 2 day rally to continue up to the gap above the February 24 high. That is a gap on both the daily and weekly charts. However, the selloff in February and March was exceptionally strong. Traders expect a 2nd leg sideways to down before there is a new all-time high.
There are now 2 sideways days in the middle of the June gap down. Also, there are reasons to go up and to go down. That increases the chance of another sideways day today. However, the 2 day rally was strong enough to make it slightly more likely that the Emini will go higher within a few days.
Overnight Emini Globex trading
The Emini is down 11 points in the Globex session. Yesterday was a bear day that closed near its low. It is a sell signal bar on the daily chart. Traders are wondering if the 2 day rally is going to form a lower high on the daily chart.
Today will probably have to test below yesterday’s low and trigger the sell signal. There is an increased chance of a big bear day because of the lower high on the daily chart. However, it is more likely that there will be buyers below yesterday’s low and that today will again be sideways. If the bulls can get today to close near its high, today will be a buy signal bar for tomorrow.
There is no strong need for a big day up or down today. This is especially true after 3 sideways weeks and 2 sideways days. Traders expect another day with at least one leg up and one leg day. It could be another trading range day. But, since today will probably trade below yesterday’s low, there is an increased chance of a bull reversal day if today trades below yesterday’s low.
Yesterday’s setups

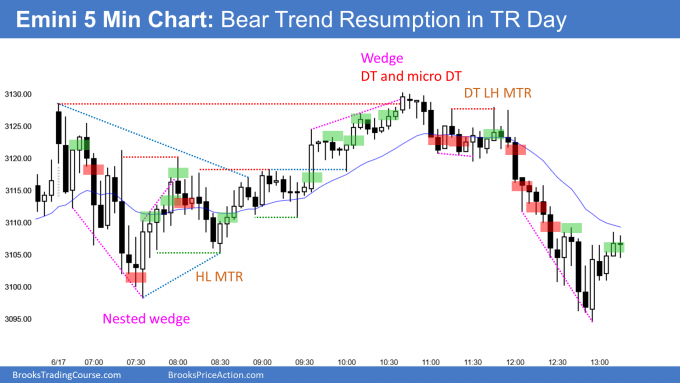
Here are several reasonable stop entry setups from yesterday. I show each buy entry with a green rectangle and each sell entry with a red rectangle. I rarely also show limit order entries and entries on the close of bars. I do not want the lines to be distracting. If they are longer, I make them dotted. But, they have to be visible, so I make the shorter ones solid. Buyers of the Brooks Trading Course and Encyclopedia of Chart Patterns have access to a much more detailed explanation of the swing trades for each day (see Online Course/BTC Daily Setups).
My goal with these charts is to present an Always In perspective. If a trader was trying to be Always In or nearly Always In a position all day, and he was not currently in the market, these entries would be logical times for him to enter.
If the risk is too big for your account, you should wait for trades with less risk or trade an alternative market like the Micro Emini.
EURUSD Forex market trading strategies

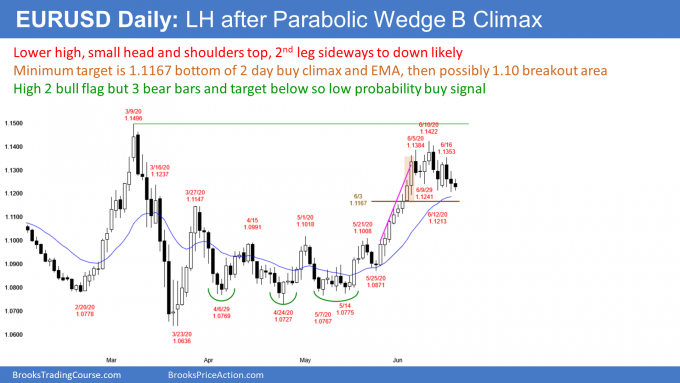
The EURUSD Forex market on the daily chart has been sideways for 3 weeks after a strong rally. There is now a small head and shoulders top. Every head and shoulders top is also a double bottom bull flag and a trading range. The bears want a measured move down. That would test the breakout above the April/May trading range at around 1.10. At a minimum, they expect a test of the June 3 low. That is the bottom of the final 2 bar buy climax in the strong rally.
The bulls see 2 legs down over the past 2 weeks. This is therefore a High 2 bull flag. But there are 3 bear bars and a magnet below. Consequently, the EURUSD will probably go at least a little lower before again trying to break above the March high.
Overnight EURUSD Forex trading
The 5 minute chart of the EURUSD Forex market has been sideways overnight within yesterday’s range. If the bulls can get the day to close near its high, today will be a credible buy signal bar for tomorrow. The bears however, expect a test of the June 3 low at a minimum. That would be more likely if today had a bear body. This is especially true if the bear body closed on the low.
With today’s small range within a 3 week range, day traders have been scalping. The odds are against a big move up or down.
Tomorrow is more important because it is Friday. It therefore affects the appearance of the weekly chart. The bears want the week to close below last week’s low.
Summary of today’s S&P Emini futures price action and what to expect tomorrow

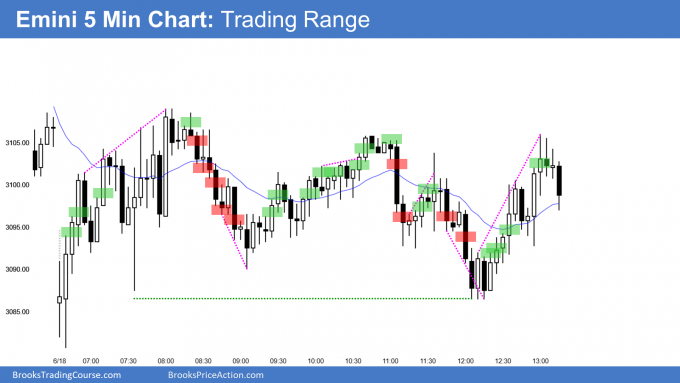
Here are several reasonable stop entry setups for today. I show each buy entry with a green rectangle and each sell entry with a red rectangle. I rarely also show limit order entries and entries on the close of bars. I do not want the lines to be distracting. If they are longer, I make them dotted. But, they have to be visible, so I make the shorter ones solid. Buyers of the Brooks Trading Course and Encyclopedia of Chart Patterns have access to a much more detailed explanation of the swing trades for each day (see Online Course/BTC Daily Setups).
My goal with these charts is to present an Always In perspective. If a trader was trying to be Always In or nearly Always In a position all day, and he was not currently in the market, these entries would be logical times for him to enter.
If the risk is too big for your account, you should wait for trades with less risk or trade an alternative market like the Micro Emini.
End of day summary
The Emini gapped below yesterday’s low, which triggered a minor sell signal on the daily chart. It quickly rallied back above yesterday’s low and entered a trading range. It straddled yesterday’s low and the 60 minute EMA all day.
Because today had a bull body on the daily chart, it is a High 1 bull flag buy signal bar for tomorrow. The bulls want the rally on Monday and Tuesday to resume. They are hoping for a test into the gap above the February 24 high.
Tomorrow is Friday so weekly support and resistance can be important. If the bulls can get the week to close near the high, this week will be a good High 1 buy signal bar on the weekly chart. That would make at least slightly higher prices likely next week.
See the weekly update for a discussion of the price action on the weekly chart and for what to expect going into next week.
Trading Room
Traders can see the end of the day bar-by-bar price action report by signing up for free at BrooksPriceAction.com. I talk about the detailed S&P Emini futures price action real-time throughout the day in the BrooksPriceAction.com trading room. We offer a 2 day free trial.
Charts use Pacific Standard Time
When I mention time, it is USA Pacific Standard Time (the Emini day session opens at 6:30 am PST, and closes at 1:15 pm PST). You can read background information on the intraday market reports on the Market Update page.
Hey Al
I bought above 35 but then exited below 37 thinking it was a possible dt Bear flag. Can you pls comment on the management of that trade
Hi Dimitri,
Sorry to keep noting same here but Al really does not have time for answering detailed trading questions. He does this in his trading room as noted above in the ‘About Al Brooks’ box.
My comment on your management would be to ask where was your stop when placing trade? If very tight and below 36/37, then you exited with a small loss as planned – but not good as you risk losing small amounts over and over until your account has gone! Your stop really should have been below 31, the swing low.
Having exited below bar 37, did you reenter above bar 40, on the bull leg resumption? If yes, then your previous trade management is acceptable given you fearlessly reenter on the next setup and recover your small loss.
Thank you Richard that was perfect. Yes I eventually did get back in.
Hi Al,
It looks like today is another limit order market during mid of the day where candles have long tails on top and bottom and it is very hard to trade.
Understand that you do not agree traders to trade in such market but sometimes I was forced to entered. Like just now, market looks break out and hit my stop order 3 ticks above prior high and reverse down immediately so I was trapped.
I have waited for another 3-4 bars where there is no bearish signal but never get back to my entry price. I then opened 1min chart and found price was moving around 20EMA. When price was lower than the EMA, buying pressure occur and buying the price up above the moving average. As a result, I bough another contract at lower price and exit at the middle of the average.
What I am curious is, in situation like this, what would you do? And if you need to scalp like this, how far you will place your stop loss ?
Hey Jeffrey,
I think this is a difficult question to answer without a specific reference to bar numbers. I think this question would be better in the forums where you can post a chart and ask.
But, in general, beginning traders should not be trading with limit orders and also should not be trading the 1min chart—moves happen to fast to make the appropriate decisions.
On days like today you want buy low, sell high, and scalping to be your operating principle. Bulls will buy prior lows, bad sell signal bars, and use a variety of stops—MM based on range, below some prior low, fixed 20 point stop, etc. Bulls then intend to scale in at some specific interval (above a good stop entry bar, every few points, etc.) and depending on the setup target their initial entry, it if disappointed they’ll exit break even. Bears do the opposite of the above.
Hope this helps!
I agree. 1 min charts are money losers for most traders. They look clear and easy, but the decisions and entries come too fast. The result is lots of mistakes. A trade will bleed to death with a thousand paper cuts.
Whenever patterns do not look quite right, the market is probably in a trading range. When in doubt, I only buy low and sell high. If it goes higher, I like to sell more. I don’t want to buy high, even to buy back a short position. It is a limit order market so there is maybe an 80% chance of sellers not too far above anything. It never looks that way, but that is the reality.
One problem that many traders have is they worry about the size of a loss and do not use wide enough stops. When a day is not clear, there will be breakouts above major prior highs and below major prior lows. The odds are that they all will fail. It is better to trade small enough to use a stop far beyond. Or, exit, but then trade a double size on a reversal back in your direction. But that means the original position is small.
A trader has a much better chance of making money in a trading range day if they can trade small and scale in. And, most importantly, avoid buying high or selling low.
Thank you so much for both of your advise!