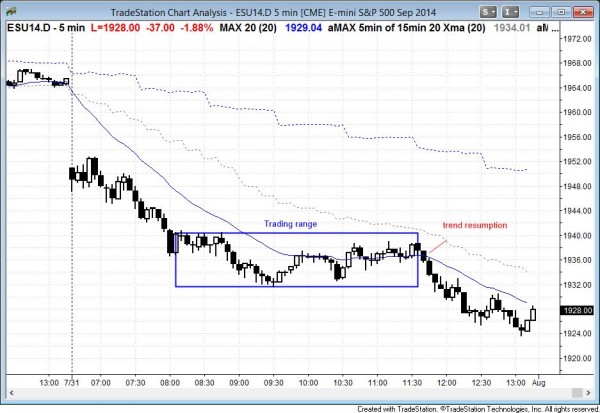
I posted this Emini chart after the close. The Emini gapped down and then entered a trading range from 8:00 am to 11:30 am. This was followed by bear trend resumption into the close. The daily and 60 minute charts are always in short. The breakout was very strong and will probably have at least a couple of legs down to some measured move targets. The breakout was so strong that I believe that my initial target of 1890 might be too conservative. Traders will sell rallies.
Posted 8:00 am PST.
The most important price action in today’s intraday update is the gap down and breakout below monthly support. The selloff down has had several reversal attempts. This increases the chances that this bear trend will evolve into a trading range, but until it does, traders will short for any reason. The bear breakout below the wedge bottom increases the chances that rallies will be limited.
Since it is the last day of the month and the Emini is near important support and resistance, the Emini will probably enter a trading range. Then, at the end of the day, it will choose among trend resumption down, trend reversal up, or more trading range into the end of the day and closing near the support and resistance. At this moment, the bears continue to sell every reversal attempt and the bulls so far have not done enough to reverse the stock market. Traders are buying new lows and selling rallies, which usually results in a trading range, but this could become a huge bear trend day.
Today is the last day of the month and therefore the Emini will be drawn to monthly support and resistance areas at the end of the day. These include the open of the month at 1957.00, the close of last month at 1952.50 the low of the month at 1947.75, and the low of the 60 minute trading range at 1946. The bears want a reversal bar on the monthly chart, which requires a close below the midpoint of the month. The bar would be stronger for the bears if it closed below the open of the month, had a bear body, had a big bear body, closed below last month’s close, and closed near its low. The bulls want the opposite of everything that the bears want.
See the weekly update for a discussion of the weekly chart.
Traders can see the end of the day bar-by-bar price action report by signing up for free at BrooksPriceAction.com. I talk about the detailed Emini price action real-time throughout the day in the BrooksPriceAction.com trading room, and a 2 day free trial is available.
When I mention time, it is USA Pacific Standard Time (the Emini day session opens at 6:30 am PST, and closes at 1:15 pm PST). You can read background information on the intraday market reports on the Intraday Market Update page.