Emini and Forex Trading Update:
Monday March 9, 2020
I will update again at the end of the day.
Pre-Open market analysis
I have been writing that the Emini will sell off dramatically if traders begin to believe that the number of coronavirus cases will increase exponentially. That is appearing to be the case.
The Emini traded limit down in the Globex session. Back in the late 1980s and early 1990s, the S&P futures often traded limit down. There was no Globex market or Eminis back then.
I do not ever remember it opening limit down. Limits were created to stop a crash. The hope is that traders will reevaluate and not sell endlessly all day in a panic like they did in the October 1987 Crash. I began my day trading career a month before that crash.
What happens after a limit down move?
The limit for the Globex market is 5% down. For the day session, there are additional limits below at 7%, 13%, and 20%. There are additional rules depending on the time of day. Emini trading resumes once trading resumes in the cash equity market.
What typically happened 30 years ago after a limit down move was that the S&P futures eventually reopened at a much lower price. Some traders would see it as an exceptional value and buy. Many bears would see it as a brief opportunity to take incredible profits. They too would buy. This buying created enough confusion to result in 2 sided trading and it prevented another crash. There would sometimes be a bull trend later that day or on the next day.
But this is bearish, as is the entire selloff from the all -time high. While climactic, there is no bottom yet. Traders should expect lower prices over the next month or more.
There were days when the S&P futures fell to the next limit down level. I think there was one day that hit a 3rd level, but I am not sure.
Most traders should not trade limit down days
Today is going to be very stressful and unusual. Most traders should not trade unless the day begins to behave normally again.
Traders have to be very careful about buying. Most traders should only buy if there is a strong bull trend reversal. Even then, they must get out before the bear trend falls to the next limit down level. It would be horribly stressful to be long and then have the market stop when you have a big loss and no way to get out. You cannot be sure that the market will even open again today. Once it reopens, it could open very far below. You would have an unbelievably big loss.
I said last week that the odds of a bear market were now more than 50%. If the Emini falls 20%, which is definition of a bear market, the average loss is 28% before the selling ends.
I also wrote a week ago that there was a 30% chance of a 30 – 50% correction. If the market hits 20% down this week, the odds of a 30 – 50% correction would be 50%.
Be careful and trade very small, if at all.
Overnight Emini Globex trading
The Emini is down 5% in the Globex session and trading has been halted. There will be a big gap down on the daily and weekly charts. Most traders should not trade at all today. Experts will trade small and will be very quick to get out of any trade, but especially out of longs.
Friday’s setups

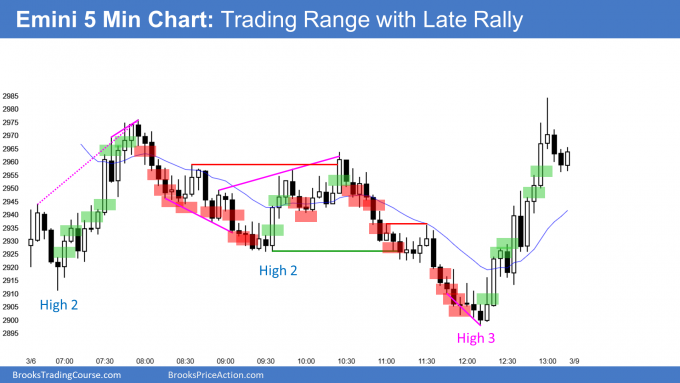
Here are several reasonable stop entry setups from Friday. I show each buy entry with a green rectangle and each sell entry with a red rectangle. I rarely also show limit order entries and entries on the close of bars. Buyers of the Brooks Trading Course and Encyclopedia of Chart Patterns have access to a much more detailed explanation of the swing trades for each day.
My goal with these charts is to present an Always In perspective. If a trader was trying to be Always In or nearly Always In a position all day, and he was not currently in the market, these entries would be logical times for him to enter.
If the risk is too big for your account, you should wait for trades with less risk or trade an alternative market like the Micro Emini.
EURUSD Forex market trading strategies

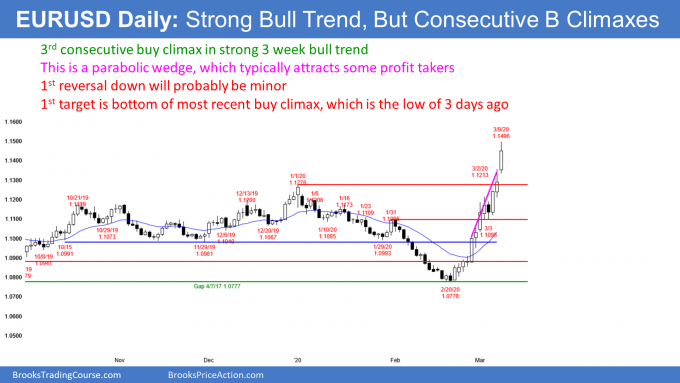
The daily chart of the EURUSD Forex market has broken far above the 18 month bear channel. Since the 3 week rally has had at least 3 surges, it is a parabolic wedge buy climax.
That typically attracts profit taking, but there is no top yet. Traders will buy the 1st pullback. But after such an extreme buy climax, the next leg up might only last a day or two. Traders should expect some sustained profit taking for a week or two beginning this week.
As I wrote over the weekend, the 2 year bear trend has probably ended. The EURUSD rally might be the resumption of the 2017 bull trend.
However, the 2 year bear trend was a Spike and Channel pattern. There is typically a rally that tests the start of the bear channel and then the chart evolves into a trading range. That is what is likely here. The EURUSD Forex market will probably be in a trading range from 1.08 to 1.18 for the next year.
Overnight EURUSD Forex trading
The 5 minute chart of the EURUSD Forex market has been sideways over night. There is a triangle on the 60 minute chart.
A triangle in a strong bull trend is a bull flag. But it is also a good candidate for the Final Bull Flag.
If there is a bear breakout, a 1 – 2 week pullback will probably begin. If instead there is a bull breakout, it will probably fail within a few days. The EURUSD will then typically get drawn back to the triangle. It will then probably trade sideways to down for a couple weeks.
Since it has been in a triangle overnight, day traders are buying low, selling high, and scalping. The legs are big and scalps have been 20 – 40 pips. If the EURUSD continues sideways, the move will get smaller.
A triangle is a Breakout Mode pattern. There is therefore an increased chance of a breakout up or down and then a trend day.
Summary of today’s S&P Emini futures price action and what to expect tomorrow
I will post chart after the close.

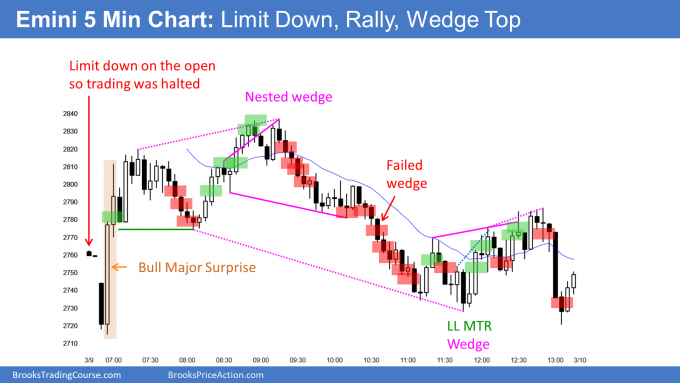
Here are several reasonable stop entry setups for today. I show each buy entry with a green rectangle and each sell entry with a red rectangle. I rarely also show limit order entries and entries on the close of bars. Buyers of the Brooks Trading Course and Encyclopedia of Chart Patterns have access to a much more detailed explanation of the swing trades for each day.
My goal with these charts is to present an Always In perspective. If a trader was trying to be Always In or nearly Always In a position all day, and he was not currently in the market, these entries would be logical times for him to enter.
If the risk is too big for your account, you should wait for trades with less risk or trade an alternative market like the Micro Emini.
End of day summary
The Emini was halted at 5% down in the Globex market. It opened 7% down in the day session, which is the 1st limit down level for the day session. When trading resumed, the Emini sold of sharply, as was likely.
Once the selloff reached 20% down from the all time high, everyone bought. The value bulls bought for a bounce and the bears took profits. A 20% correction is a bear market, which is likely soon. The day then entered a big range between the Globex limit down price and the day session limit down price.
Because the daily chart is so oversold, it will probably soon have a big rally for a couple weeks. It might begin this week.
However, once there is a close that is 20% below the all-time highest close, it usually leads to lower prices over the next 2 – 3 months. On average, traders expect 28% down from the high. They should also expect a recession later this year. Most importantly, they should expect a trading range for the next decade.
See the weekly update for a discussion of the price action on the weekly chart and for what to expect going into next week.
Trading Room
Traders can see the end of the day bar-by-bar price action report by signing up for free at BrooksPriceAction.com. I talk about the detailed S&P Emini futures price action real-time throughout the day in the BrooksPriceAction.com trading room. We offer a 2 day free trial.
Charts use Pacific Standard Time
When I mention time, it is USA Pacific Standard Time (the Emini day session opens at 6:30 am PST, and closes at 1:15 pm PST). You can read background information on the intraday market reports on the Market Update page.
How is the 7% limit calculated? Friday’s close was at 2963.75 and 7% down should be 2756.25 but the market seems to have been halted at 2819. Just curious as this is quite an interesting event for most traders starting out.
You can read that CME link. I mentioned it in the room. They take an average based on Friday’s closing range.