Emini and Forex Trading Update:
Friday March 20, 2020
I will update again at the end of the day.
Pre-Open market analysis
Yesterday triggered a buy signal by going above Wednesday’s high. There is a 5 day micro wedge nested within a month-long parabolic wedge sell climax. However, the bulls failed yesterday to get a big bull bar closing on its high. After a weak buy signal bar, yesterday was a disappointing entry bar.
There is an extreme sell climax at support. That support is the December 2018 low at the bottom of the 2 year trading range. The Emini also tested the open of January 20, 2017. That is when Trump became president.
Traders know that the bears will buy back shorts soon. Their profit taking will likely cause a strong short covering rally. It could last several weeks. But until the bulls get a couple big bull bars closing on their highs, the trend is still down.
There is a 40% chance of a collapse to 2000 within the next couple weeks. More likely, the stock market will soon either stop going down and enter a tight trading range or it will have a short covering rally.
Importance of Friday’s close
Today is Friday so it will affect the appearance of this week’s candlestick on the weekly chart. If the bulls get a close above the open, this week would be a bull reversal bar. That would increase the chance that the short covering rally will begin next week.
But the bears always want the opposite. They want the week to close below the December 2017 low and on the low of the week. Traders would then wonder if the Emini would collapse down below 2000 before there is a short covering rally.
Currently, the Emini is far from both prices. The next magnet then is the 2405 midpoint of the week. If the bulls get a close above 2405, that would make the week slightly more bullish than bearish. It would increase the chance that the bulls will get a rally next week. But if the bears get a close far below 2405, traders will think that there might be another leg down to 2000 by the end of the month.
Overnight Emini Globex trading
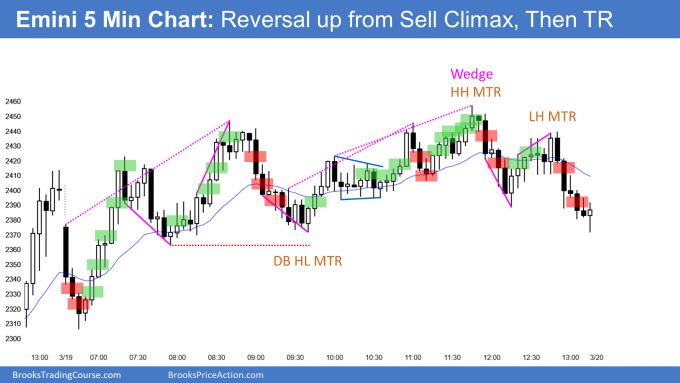
The Emini rallied overnight, but it has retraced most of that rally over the past 3 hours. It currently is trading just above the midpoint of the week on the day session. It might spend the day oscillating around that price, especially since it did that for most of yesterday.
With the huge days that the Emini has had for several weeks, there is an increased chance of a surprisingly big trend up or down. But since it has been sideways for 2 days at the support of the December 2018 low, today will probably be a trading range day. Then, in the final hour, traders will decide if the week will close below the 2342.25 December 2018 low or above the 2405 midpoint of the week. The close will affect the probabilities of either a continued bear trend or a short covering rally next week.
Yesterday’s setups

Here are several reasonable stop entry setups from yesterday. I show each buy entry with a green rectangle and each sell entry with a red rectangle. I rarely also show limit order entries and entries on the close of bars. Buyers of the Brooks Trading Course and Encyclopedia of Chart Patterns have access to a much more detailed explanation of the swing trades for each day.
My goal with these charts is to present an Always In perspective. If a trader was trying to be Always In or nearly Always In a position all day, and he was not currently in the market, these entries would be logical times for him to enter.
If the risk is too big for your account, you should wait for trades with less risk or trade an alternative market like the Micro Emini.
EURUSD Forex market trading strategies

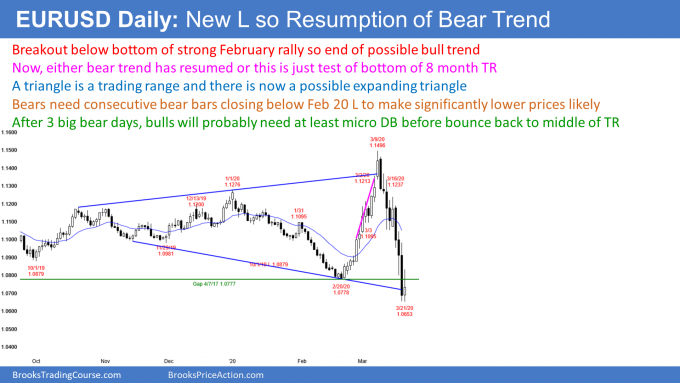
The daily chart of the EURUSD Forex market has had increasing big moves up and down. Because of the new low, the bulls lost the argument that the March rally might be the start of a bull trend. With the new low, the bear trend has resumed.
But, every triangle, including an expanding triangle, is a trading range. If the EURUSD reverses up strongly from here within a couple weeks, the EURUSD will still be in its 8 month trading range as well as in a 2 year bear trend.
What traders are deciding is whether the selloff will continue down to par (1.00) this year. If the bears get consecutive bear bars closing below the February low, the odds of at least a small 2nd leg down will increase. That will make a resumption of the bear trend more likely than an expanding triangle bottom.
However, if the bulls get a strong reversal up, especially from a micro double bottom or small double bottom, traders will conclude that the current bear breakout will fail, just like the March bull breakout failed. They would then expect a continuation of the trading range and a rally back up to the middle at a minimum. The chart will give traders information over the next couple of weeks that will help them decide which is more likely.
Overnight EURUSD Forex trading
The 5 minute chart of the EURUSD Forex market dipped below yesterday’s low overnight, rallied strongly, but then gave back more than half of the rally. The rally was a spike and channel bull trend. That typically evolves into a trading range. The EURUSD has been sideways for 4 hours.
Today is Friday and day traders will pay attention to weekly support and resistance. Not only do the bulls want today to have a bull body on the daily chart, they want the weekly chart to close above the February low. That is about 20 pips above the current price and certainly within reach.
Day traders have been scalping for 20 – 30 pips for several hours and will continue to do so unless there is a strong breakout up or down. Most likely, the trading range will continue for the rest of the day and the main fight will be whether the EURUSD will close above the February low.
The overnight rally makes it unlikely that the bears will get a 2nd consecutive bear day closing below the February low today.
Summary of today’s S&P Emini futures price action and what to expect tomorrow

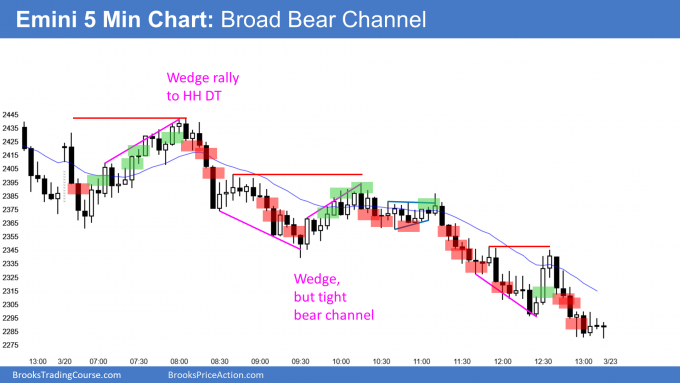
Here are several reasonable stop entry setups for today. I show each buy entry with a green rectangle and each sell entry with a red rectangle. I rarely also show limit order entries and entries on the close of bars. Buyers of the Brooks Trading Course and Encyclopedia of Chart Patterns have access to a much more detailed explanation of the swing trades for each day.
My goal with these charts is to present an Always In perspective. If a trader was trying to be Always In or nearly Always In a position all day, and he was not currently in the market, these entries would be logical times for him to enter.
If the risk is too big for your account, you should wait for trades with less risk or trade an alternative market like the Micro Emini.
End of day summary
After an early wedge rally, the Emini sold off in a broad bear channel today. At the end of the day, the Emini finally got back down to just below 2283.00. It closed slightly above. That was the price of the open of January 20, 2017 on the day President Trump assumed office. This tells you that the market might be sending a message of disapproval.
It does not matter that there is a parabolic wedge on the daily chart. The market wants to go down. Sell climaxes can fall very far before there is profit taking. There is no bottom yet and therefore traders should continue to expect lower prices. But, they have to be ready for a strong short covering rally to begin at any time.
See the weekly update for a discussion of the price action on the weekly chart and for what to expect going into next week.
Trading Room
Traders can see the end of the day bar-by-bar price action report by signing up for free at BrooksPriceAction.com. I talk about the detailed S&P Emini futures price action real-time throughout the day in the BrooksPriceAction.com trading room. We offer a 2 day free trial.
Charts use Pacific Standard Time
When I mention time, it is USA Pacific Standard Time (the Emini day session opens at 6:30 am PST, and closes at 1:15 pm PST). You can read background information on the intraday market reports on the Market Update page.
Hi all,
Just wanna express my disappointment on a bull trap. (The bar at 2:05pm EST) I was just had a bull trapped before the bear break out started just now. The market was in a trading range then I found there are two bull bars with a pause. Therefore I expect there should in a bull break out (especially the price gets above the previous few bars trading range) and I long a contract.
Just few seconds after I entered the market, I found the bull bar was unexpectedly strong and suddenly fear it is a bull climax (Didn’t expect a climax will come so early. Or maybe it shouldn’t called as climax?) The market then reverse back and bear break out immediately. Also afterwards I then realized that the price reached but failed to break the high at 1:00pm EST.
This unexpected bear break out nearly wiped out all my profit. Though the market is in a bear break out but I am very tired (it is midnight in my time zone) and fear of further losing so I didn’t go short…
Do anyone of you have similar experience or any advice so I could learn to avoid similar things happen again?
I did the same thing too. You can see Al also marked it as a buy on his chart. But it wasn’t hard for me to reverse and take the sell because I was expecting a swing down from the lower high major trend reversal pattern and double top bear flag. There was also a wedge on the way up, and if you drew a trendline from the highs, the bull bar never really got above it.
One thing to make one skeptical of the buy was that most of the previous ten bars closed below the moving average.
Whenever the market is trending down, there is often a short covering rally late in the day. I always assume that it will be a bull trap, especially when the bear channel is tight, like it was today. The reversal up was likely to be minor. When I buy (and I did) in a tight bear channel, I almost always exit around the MA, especially if there is a big bull bar closing near its high. If the minor reversal breaks far above the EMA with 2 or more big bull bars closing on their highs, it is then a Buy The Close rally and a major trend reversal (30% chance). I can always buy again. However, when I buy in a tight bear channel (or in a trading range), I expect any rally to disappoint the bulls. I want to stress that a big bull bar closing near the EMA in a bear trend typically attracts more sellers than buyers. I therefore always plan to take quick profits and then wait to see what comes next. If I am flat, I see it as a sell the close bar.
Thanks for all you do Al. Enjoy your day off (from talking)