Emini and Forex Trading Update:
Thursday May 14, 2020
I will update again at the end of the day.
Pre-Open market analysis
The bears got 2 big bear days this week. The Emini turned down from just below the top of the wedge on the daily chart.
This week traded above last week’s high and then below its low. It is an outside down week on the weekly chart.
The bears want this week to close below last week’s low. It would then be a stronger outside down candlestick on the weekly chart. Also, it would be a 2nd reversal down from the 20 week EMA. A 2nd attempt to sell off has a higher probability of success.
This is probably the start of a move down to 2600. However, if the bulls get a reversal up today or tomorrow, traders will wonder if the selloff is a bear trap. The bulls then would again try to break above the wedge top and test the 200 day moving average around 3,000.
It is important to note that yesterday repeatedly tried to break below the low of 2 weeks ago, yet it kept reversing up. It would have been better for the bears is instead the Emini collapsed below that support and closed far below it.
Will today be a 3rd consecutive strong bear day? Probably not because it is in a 2 1/2 year trading range. Trading ranges tend to disappoint traders. Also, there was short-covering into yesterday’s close. Today should have at least a couple hours of sideways to up trading.
But the bears will sell the 1st 1 – 2 day bounce. Traders expect lower prices over the next 2 – 3 weeks.
Overnight Emini Globex trading
The Emini is down 32 points in the Globex session. The bears want today to close far below the May 4 low of 2788.50. That is the neckline of the 2 week double top. A big bear breakout will make it likely that the Emini will continue down to 2600 in May or June.
The bulls always want the opposite. Traders know that the bears have not had 3 consecutive strong bear days since February. They will watch for a reversal up today. It can come at any time.
If the bears do get a 3rd consecutive bear day, then the move will probably continue down to 2600. There will be bounces along the way, especially since the current selloff is already extreme. Traders will sell the 1st 1 – 3 day bounce.
Since traders want to know if the bears can get a 3rd strong bear day, the bulls might wait for a few hours to see how strong the bears can be. If they conclude that the bears are not strong enough, they will try to create a midday reversal. If they get a strong reversal, the 3 day selloff could become just a pullback in the rally up to 3000 and the 200 day MA.
Yesterday’s setups

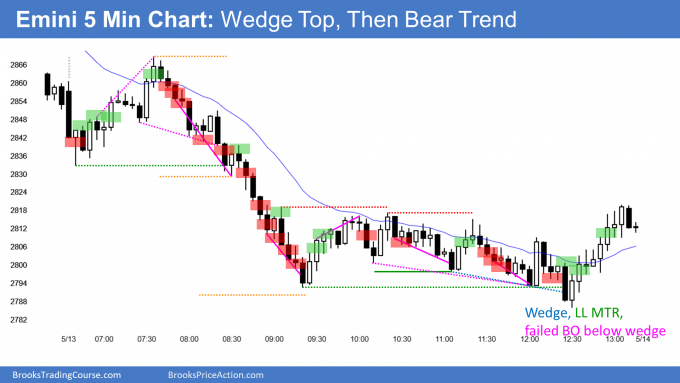
Here are several reasonable stop entry setups from yesterday. I show each buy entry with a green rectangle and each sell entry with a red rectangle. I rarely also show limit order entries and entries on the close of bars. Buyers of the Brooks Trading Course and Encyclopedia of Chart Patterns have access to a much more detailed explanation of the swing trades for each day (see Online Course/BTC Daily Setups).
My goal with these charts is to present an Always In perspective. If a trader was trying to be Always In or nearly Always In a position all day, and he was not currently in the market, these entries would be logical times for him to enter.
If the risk is too big for your account, you should wait for trades with less risk or trade an alternative market like the Micro Emini.
EURUSD Forex market trading strategies

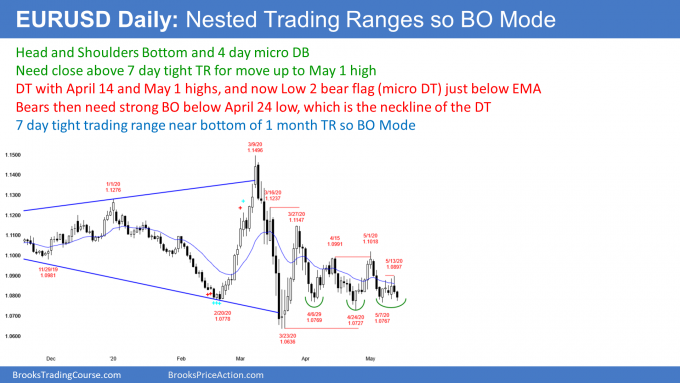
The EURUSD Forex market on the daily chart has been in a tight trading range for 7 days. That range is at the bottom of a month-long range and a 9 month range.
The bulls have had many good attempts at reversing up for 2 months. Yet, they are unable to get a sustained rally. The chart is looking heavy.
While the reversals and strong bull bars are good for the bulls, the inability to do what appears likely is bad. At some point, if a market repeatedly tries to do something and it is unable to do it, it will try the opposite.
Traders believe that these repeated failures by the bulls mean that those bull bars and rallies are not as good as they appear. There is a 50% chance that the EURUSD will break to the downside and fall to par rather than rallying above the March high.
Yesterday reversed down from the 20 day EMA. it was the 2nd reversal down in 4 days. This is a Low 2 bear flag below the EMA. The sell signal triggered overnight when today traded below yesterday’s low.
The bulls need a reversal back up within the next few days to make traders think that the bottoming process is continuing. If they fail to get what they need, the bears will get a break below the April 24 low and then probably below the March 23 low.
The EURUSD might trigger a monthly sell signal this week
In my weekend reports, I mentioned several times that there is an ioi Breakout Mode setup on the monthly chart. If the EURUSD falls below the April low, it will trigger the monthly sell signal.
Remember, the monthly chart has been in a bear trend for 2 years. Most of the closes have been below the 20 month EMA. A break below the April low will be a reminder that the bears are still in control. Traders will then expect a test of the January 2017 major higher low and then par (1.0).
Overnight EURUSD Forex trading
The 5 minute chart of the EURUSD Forex market had a brief breakout below yesterday’s low overnight, but it has been sideways for 3 hours. Yesterday was a good looking sell signal bar on the daily chart. Today is the entry bar. If today closes near its low, today will be a good entry bar. That will increase the chance of a break below the April low, which would trigger a monthly sell signal.
Because the EURUSD has been sideways for 3 hours, the bulls are willing to buy reversals up from the bottom. This is especially true because the EURUSD is at the bottom of a 7 day tight trading range. Furthermore, the bulls still have a potential head and shoulders bottom on the daily chart. If they can get a reversal to back above yesterday’s low and today’s open, today will be a buy signal bar on the daily chart.
The bears do not need to do more today than what they have already done. If today closes where it is now, the daily chart will have a good bear body and be a good entry bar for the Low 2 sell signal. That would increase the chance of lower prices tomorrow. They will continue to sell rallies, trying to put the close near the low.
The lack of sustained selling over night reduces the chance of a big move down from here. When there is no energy, the market tends to stay sideways. Day traders scalp in both directions as they wait for a breakout in either direction.
Summary of today’s S&P Emini futures price action and what to expect tomorrow

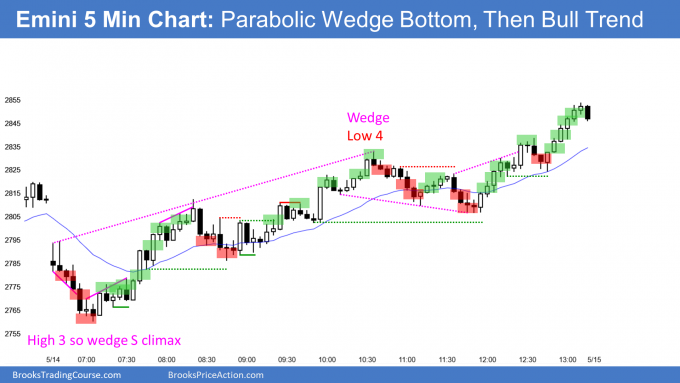
Here are several reasonable stop entry setups for today. I show each buy entry with a green rectangle and each sell entry with a red rectangle. I rarely also show limit order entries and entries on the close of bars. Buyers of the Brooks Trading Course and Encyclopedia of Chart Patterns have access to a much more detailed explanation of the swing trades for each day (see Online Course/BTC Daily Setups).
My goal with these charts is to present an Always In perspective. If a trader was trying to be Always In or nearly Always In a position all day, and he was not currently in the market, these entries would be logical times for him to enter.
If the risk is too big for your account, you should wait for trades with less risk or trade an alternative market like the Micro Emini.
End of day summary
The bulls got a strong rally today from below the May 4 low. That is the neckline of the 2 week double top. Tomorrow is now a buy signal bar on the daily chart.
The bulls want the Emini to continue up to the 200 day moving average, which is at the 3,000 Big Round Number. That would trigger the monthly buy signal and run the stops on the bears who are short from the wedge top and double top.
What is now more likely, a pullback from a 2 day selloff and then a continuation down to 2600? Or, a resumption of the bull trend? The extreme buy climax and the strong reversal down from the wedge and double top make the selloff slightly more likely. A lot depends on tomorrow. If tomorrow is a big bull day, the odds will switch back in favor of the bulls.
See the weekly update for a discussion of the price action on the weekly chart and for what to expect going into next week.
Trading Room
Traders can see the end of the day bar-by-bar price action report by signing up for free at BrooksPriceAction.com. I talk about the detailed S&P Emini futures price action real-time throughout the day in the BrooksPriceAction.com trading room. We offer a 2 day free trial.
Charts use Pacific Standard Time
When I mention time, it is USA Pacific Standard Time (the Emini day session opens at 6:30 am PST, and closes at 1:15 pm PST). You can read background information on the intraday market reports on the Market Update page.
Hey Al
You have 2 types of horizontal lines on your end of day summary chart. One is small and one dotted. What are they please?
The dotted ones are double tops & bottoms
I do not want the lines to be distracting. If they are longer, I make them dotted. But, they have to be visible, so I make the shorter ones solid.
See slide 4 of the Daily Setups for an explanation.
Hey Al,
In your one book you say you will not be profitable in the long term until you find a compatible style. I have weeks where I do well then slower periods an some bad days too. I try to swing with stops most of the time but find myself instinctively using market orders buying pbs an below bars more comfortable with the less risk too, such as today I bought above 10 not a good single bar an the 12 close. I know we should be patient an wait for good stop entry’s an can lose bigger with limits… I misread a trade yesterday and see your point but with so many days like today with bad signals should I do what comes instinctively or force myself to be patient an wait for good signals an stops. I kinda feel torn on this.
Many signals are bad because the risk is great. A trader can always reduce risk by trading small, like the micro Emini. He can increase probability by using wide stops and scaling in.
That sounds easy but most traders soon discover that they are not trading nearly small enough. When it comes time to scale in, they are too afraid. Since their trade required a wide stop and scaling it, they lose.
It is always important to trade within one’s comfort zone. I see lots of trades every day that I do not take because other types are more fun. Sometimes a trade will set up but I know the management could be complicated. If I am tired, I don’t take it.
A swing trader only needs to take one or two trades a day to do well. It can be hard to wait, but that is the best option.
Or, as I said, a trader can always trade small and take other trades that might be more work or benefit from scaling it.
Your point about being comfortable is very important. Traders should be trading for both fun and profit.