Emini parabolic buy climax testing top of December sell climax
I will update again at the end of the day.
Pre-Open market analysis
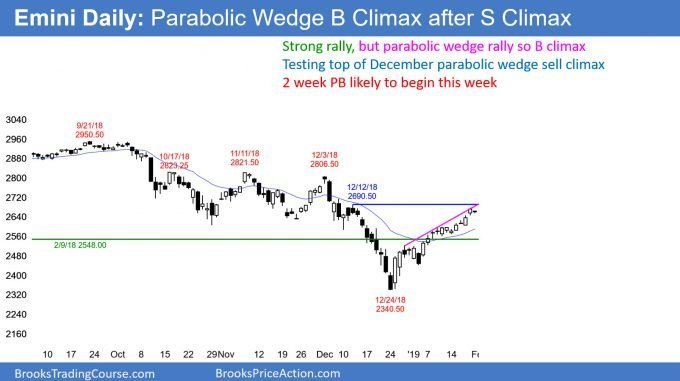
The Emini has rallied strongly in a tight bull channel for 4 weeks. There are 3 legs up in the channel. This is therefore a parabolic wedge buy climax. The Emini is just below the December 12 high of 2690.50. That was the high of the parabolic wedge sell climax and a logical magnet.
A 1 – 2 week pullback typically follows a parabolic wedge rally to resistance. Because Thursday and Friday were strong, the Emini has 60% chance of first having a 1 – 3 day rally to above the December 12 high this week.
Risk managers will then tell their traders to reduce their longs. Their stops are now far below. Consequently, there is a significant risk of giving back an unacceptable amount of profit. The result of the profit taking will likely be a couple weeks of sideways to down trading. This should start by the end of this week.
Overnight Emini Globex trading
The Emini is down 16 points in the Globex session. Traders are deciding between a 1 – 3 day rally to a new buy climax high and the start of a 1 – 2 week pullback to support.
Because of the lack of clarity, day traders will mostly scalp. If there is a strong rally, swing traders will look for a major trend reversal. They expect a reversal down to be strong enough to begin a 1 – 2 week sideways to down move.
Alternatively, if there is a strong bear breakout, day traders will conclude that the pullback is underway.
A buy climax means that the bulls are exhausted. They begin to take profits on rallies. However, they doubt the resolve of the bears. They therefore continue to buy selloffs to below prior lows.
This most often leads to an Endless Pullback. That is essentially a tight trading range that is tilted down. Traders should expect that for the next couple of weeks.
Daily Chart has buy climax

EURUSD daily Forex chart has small wedge sell climax in trading range

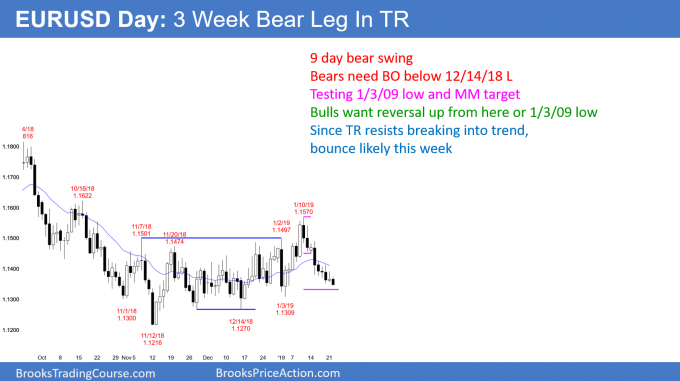
The EURUSD daily Forex chart has sold off for 3 weeks. It is now testing the bottom of its 3 month trading range. The selloff initially was a bull flag. That failed with the big bear bar 2 weeks ago. Now, the bulls have a 5 day wedge. In addition, it is still above the December 14 double bottom.
Trading ranges resist breaking out. My 80% rule says that 80% of attempts reverse. Consequently, this selloff will probably bounce this week.
However, it might first reach the measured move target just below the 1.13 Big Round Number. That is just below the January 3 start of the last rally. Because that is support, weak traders will have stops there, which makes it a magnet.
Overnight EURUSD Forex trading
The 3 week selloff has been losing momentum over the 5 days. The ranges on the daily chart are getting smaller. In addition, the candlesticks have prominent tails above and below. Furthermore, the bars are beginning to largely overlap one another. Finally, the 3 small pushes down create a wedge.
The bulls have been buying new lows and reversals up from prior low. Also, the bears continue to sell rallies, but now are taking profits below prior lows. This price action is typically a transition into a trading range. Day traders will probably continue to scalp today.
The odds favor a 50 – 100 pip bounce beginning over the next few days. This would be a bull leg in the developing small trading range.
Summary of today’s S&P Emini futures price action and what to expect tomorrow

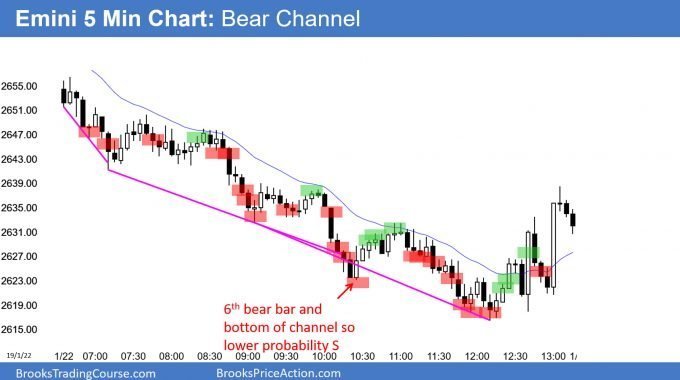
Here are several reasonable stop entry setups for today. I show each buy entry with a green rectangle and each sell entry with a red rectangle. I rarely also show limit order entries and entries on the close of bars. My goal with these charts is to present an Always In perspective. If a trader was trying to be Always In or nearly Always In a position all day, and he was not currently in the market, these entries would be logical times for him to enter.
End of day summary
The Emini sold off in a bear channel today. Because the daily chart has a parabolic wedge buy climax, the bulls are taking profits. This typically results in a 5 – 10 pullback. That means a week or two of sideways to down trading.
Even if there is a strong rally over the next few days, the 4 week buy climax will make risk managers force traders to lighten up. Therefore, traders will sell above last week’s high, expecting the rally to pause for a couple weeks.
See the weekly update for a discussion of the price action on the weekly chart and for what to expect going into next week.
Trading Room
Traders can see the end of the day bar-by-bar price action report by signing up for free at BrooksPriceAction.com. I talk about the detailed S&P Emini futures price action real-time throughout the day in the BrooksPriceAction.com trading room. We offer a 2 day free trial.
Charts use Pacific Standard Time
When I mention time, it is USA Pacific Standard Time (the Emini day session opens at 6:30 am PST, and closes at 1:15 pm PST). You can read background information on the intraday market reports on the Intraday Market Update page.
Hi Al,
Wondering why you have some of the pullbacks marked as a buy entry? I remember you saying that if it’s a tight channel not to trade against the market. As we can see in final chart most of those buy entries would have ended up in a loss.
I agree with your point. You are correct that it is much easier to make money selling in a bear trend. I addressed that in the chat room many times today. But, the odds were that the bulls would get a rally by the end of the day. However, I repeatedly said that stop entries for each of those buys were not good enough for most traders because they would likely fail at the EMA. A trader would have to make quick decisions, and beginners cannot do that reliably. This was true for every stop entry buy except for the last one, which I said was likely to lead to a short-covering rally (bear profit taking rally).
I said that experienced bulls can make money buying if they buy with limit orders at or below the prior low and scalp out near the EMA. I made the point that beginners should not do this because they would panic out with a loss if the selloff continued after they entered. Instead, it is better to buy more and not exit longs. This is not something for beginners.
In addition, I said the bears would sell at the EMA and on a reversal down from there. However, for the charts that I post here, I restrict the signals to reasonable stop entries, which are what beginners should trade. Because the day was a bear channel with no closes above the EMA until after noon, I said many times that every buy was a scalp (except for the final one, which I said was a good swing buy).