Emini and Forex Trading Update:
Thursday May 7, 2020
I will update again at the end of the day.
Pre-Open market analysis
The Emini yesterday traded below Tuesday’s low. That triggered a sell signal on the daily chart. This week triggered a minor sell signal on the weekly chart when Monday traded below last week’s low.
But the daily chart has been sideways for a month and it has had many minor reversals. It could not do this is the bears were strongly in control. With the Globex rally, the bulls have a 50% chance of a break above the April high before the selloff continues down to 2600. Traders want to see 2 or 3 consecutive strong bear bars before concluding that the Emini has begun its selloff down to 2600.
If there is a move to above the top of the wedge, the odds are it would fail. A reversal down would be a 2nd sell signal, which has a higher probability of starting a 2 – 3 week swing down.
Most days over the past month have had swings up and down on the 5 minute chart. Day traders will continue to look for intraday reversals and 2 – 3 hour swing trades.
The importance of the end of the week
Tomorrow is Friday so traders are starting to consider how the week will look on the weekly chart. This week triggered a minor weekly sell signal. However, it reversed up from below last week’s low.
The bulls would like the week to close above last week’s high. That would be a failed weekly sell signal. Of additional importance is that it would also mean that the wedge top on the daily chart failed. Furthermore, it would trigger the High 1 monthly buy signal.
Doing something bullish on all 3 time frames at the same time is unusual. It would be a sign of strength and increase the chance of at least slightly higher prices next week.
Overnight Emini Globex trading
The Emini is up 45 points in the Globex session. On the Globex daily chart, today traded below yesterday’s low and it is now near yesterday’s high. Today will probably form an outside up day on the daily Globex chart.
Today will open with a big gap up and near yesterday’s high. The bears would like a reversal down from a double top with Tuesday’s high. However, the April high is an important magnet just above the Globex high. With today’s gap up, there is a 50% chance that the bulls will achieve their goal today.
The bears have a clear wedge top on the daily chart. They have reversed down twice, but are failing a 2nd time. When the market fails twice, it often tries the opposite direction. That increases the chance of a bull trend today.
Can today reverse down from a double top with Tuesday’s high. Of course, and that would be good for the bears. If it today rallies to around Tuesday’s high and enters a trading range, day traders will look for a reversal down.
Yesterday’s setups

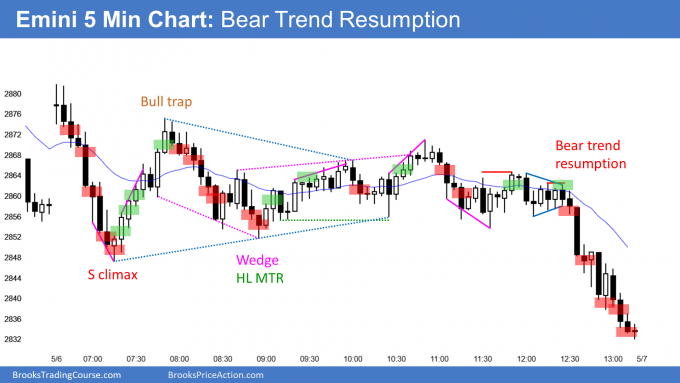
Here are several reasonable stop entry setups from yesterday. I show each buy entry with a green rectangle and each sell entry with a red rectangle. I rarely also show limit order entries and entries on the close of bars. Buyers of the Brooks Trading Course and Encyclopedia of Chart Patterns have access to a much more detailed explanation of the swing trades for each day (see Online Course/BTC Daily Setups).
My goal with these charts is to present an Always In perspective. If a trader was trying to be Always In or nearly Always In a position all day, and he was not currently in the market, these entries would be logical times for him to enter.
If the risk is too big for your account, you should wait for trades with less risk or trade an alternative market like the Micro Emini.
EURUSD Forex market trading strategies

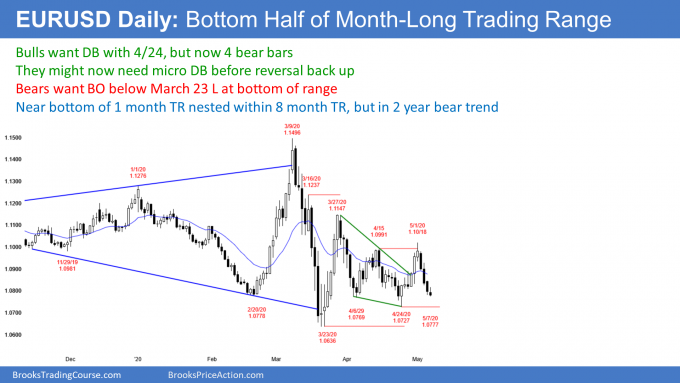
The EURUSD Forex market on the daily chart has sold off for 4 days. The selloff is strong enough so that there is now almost a 50% chance of a break below the April 24 low.
Even though there is a 7 week trading range within a 9 month trading range, the weekly chart has been in a bear trend for 2 years. That means the odds of lower prices will always slightly favor the bears.
The EURUSD had been reversing every week for 7 weeks. Traders therefore expect a reversal up within a few days. This is true even if the EURUSD falls below the April 24 low first.
However, after 4 days down, traders will probably want the selling to stop for a couple days before looking to buy aggressively. On the 5 minute chart, they want to see the 4 day bear channel evolve into a trading range for a day or two.
Overnight EURUSD Forex trading
The 5 minute chart of the EURUSD Forex market sold off in a weak bear channel overnight. But, it is bouncing from below yesterday’s low.
The overnight channel had relatively big bounces. It is more of a trading range that is tilted down a little than a bear trend. This is a possible transition from a 4 day bear trend into a trading range on the 5 minute chart.
Even though the EURUSD has been forming lower highs and lows overnight, the new lows are only a few pips below the old. Traders are buying at the low. This is trading range price action.
After 4 days down and the trend weakening, there is less chance of a bear trend today. Also, the EURUSD is at the bottom of a 7 week trading range. Day traders expect a reversal up soon. But as I said, the bulls might 1st have to stop the selling for a day or two before they will buy for a swing up. That increases the chance that today will be a trading range or have a weak reversal up.
I have mentioned a few times this week that last week’s low is important. While last week was a Low 2 sell signal bar, it had a big bull body. That made it likely that there would be more buyers than sellers below its low.
So far, this week is barely below last week’s low. That low will probably be a magnet for the rest of the week. It is another reason why today will probably not sell off.
Summary of today’s S&P Emini futures price action and what to expect tomorrow

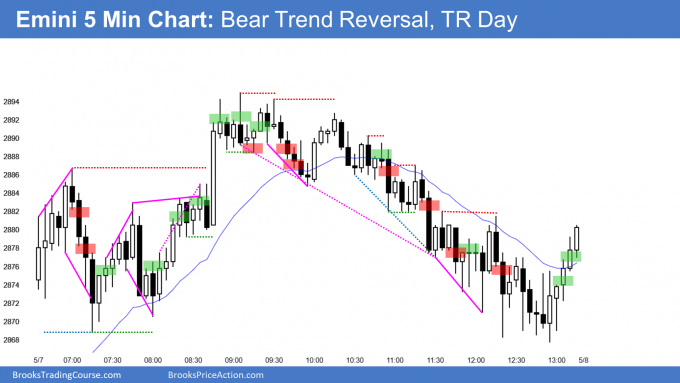
Here are several reasonable stop entry setups for today. I show each buy entry with a green rectangle and each sell entry with a red rectangle. I rarely also show limit order entries and entries on the close of bars. Buyers of the Brooks Trading Course and Encyclopedia of Chart Patterns have access to a much more detailed explanation of the swing trades for each day (see Online Course/BTC Daily Setups).
My goal with these charts is to present an Always In perspective. If a trader was trying to be Always In or nearly Always In a position all day, and he was not currently in the market, these entries would be logical times for him to enter.
If the risk is too big for your account, you should wait for trades with less risk or trade an alternative market like the Micro Emini.
End of day summary
The Emini gapped up and formed a trading range day. It will probably try to form a small head and shoulders top on the 60 minute chart. Today might be the head.
This 4 day rally is the right shoulder of a bigger head and shoulders top. The April 17 left shoulder and the April 29 head both subdivided into smaller head and shoulders tops. The current right shoulder is trying to do the same.
The bulls have a 30% chance of the rally continuing up to a new all-time high this year. The odds favor a 2 – 3 week pullback to 2600 at some point in May.
See the weekly update for a discussion of the price action on the weekly chart and for what to expect going into next week.
Trading Room
Traders can see the end of the day bar-by-bar price action report by signing up for free at BrooksPriceAction.com. I talk about the detailed S&P Emini futures price action real-time throughout the day in the BrooksPriceAction.com trading room. We offer a 2 day free trial.
Charts use Pacific Standard Time
When I mention time, it is USA Pacific Standard Time (the Emini day session opens at 6:30 am PST, and closes at 1:15 pm PST). You can read background information on the intraday market reports on the Market Update page.
Hi Al,
bar 51 bull set up and 52 bear set up.
Many reasons for and against both trades. Did you see one major reason, which favored bear BO over bull BO?
thx
Curios whether the bear reversal bar after 10:00 PST could be considered a credible MTR LH setup (short); it seemed to set up the bear leg in the TR day.
With the 4 bull bars, a minor reversal was more likely. The bulls triggered a wedge bull flag 6 bars later. Once that failed, the bears took more control. The entire selloff looked like and was a bear leg in a trading range.
Thanks. I appreciate your analysis.
Hi Al,
I saw in the 5min chart you posted now includes green and red dashed-lines, are they the protection stops? These protection stops are extremely useful. Thank you
They indicate small double bottoms and tops.
I am tired to watch the price keep grinding up.
What you are saying is perfectly natural. Whenever a trader feels annoyed or anxious about what the market is doing (in this case, going up), it is his radar telling him that he believes it will go higher. The anxiety comes from wanting to buy, but not at the high because the rally does not look strong enough. Markets climb a wall of worry.
By the time a pullback comes, it looks like a reversal and not a bull flag, and then the trader still does not want to buy.
Every one wants minimal risk, which means high certainty, but it cannot exist. Traders live in a gray fog and things are rarely as clear as anyone wants.
Becoming peaceful with that uncertainty helps with happiness and profitability. You will sometimes hear, “Do not fight the tape.” Your radar is working well. It takes time to become comfortable with the lack of clarity and to figure out how to profit from it.
Hi Al: Beginner here. What do you think the unprecedented QE is going to affect the stock market. Does technical analysis still hold as usual?
Price is truth 🙂
Technical analysis is based in genetics. The charts are simply a map of rational human behavior.
Quantitative Easing is just one of countless factors that influence the decisions of the institutions. If you want to know what their consensus view is, just look at a chart. It represents to running total of dollars expecting the market continue up and the dollars expecting it to go down.
I never worry about fundamentals, like QE. All I care about is whether more institutional dollars are buying or selling. I let the institutions analyse the data.
The charts tell me how they perceive the information. The market is a market of institutions. They created it and they do 95% of trading. Their behavior controls the markets. The charts show us their behavior.
I want to trade in the direction of the bulk of the money. When it comes to institutional money, the vast majority of it is traded based on math, which means rational thought. It does not matter what variables they are considering. All that matters is whether more are buying or selling.