Emini and Forex Trading Update:
Friday May 22, 2020
I will update again at the end of the day.
Pre-Open market analysis
Every day this week has traded around the April high. It might stay around the April high through the end of the month.
The bulls want May to close far above the April high. Traders would then expect higher prices in June. The bears want May to close at or below the April high. That would increase the chance of sideways to down prices for a month or so.
Traders are deciding if the monthly buy signal will lead to a strong rally on the monthly chart. Probably not. There will be sellers above the 200 day moving average and around the March 3 lower high. That sell zone is 3,000 – 3,100. The 2 month rally will probably exhaust itself there. Traders should then expect about a 50% retracement.
Overnight Emini Globex trading
The Emini is up 4 points in the Globex session after selling off 30 points early in the session. Today will open near the April high, which is where it has been every day this week.
With every day having a lot of trading range price action, day traders will expect that again today. However, every day has also had at least a small swing up and down.
Today is Friday and weekly support and resistance can be important. At a minimum, the bulls want a bull body on the weekly chart. They therefore want the week to close above the 2927.00 open of the week.
They also want the week to close above the 2947.25 April high. That would encourage the bulls because it would continue to make a move up to the 200 day moving average likely.
The bears want the opposite. Not only do they want the week to close below both of those magnets, they want the week to close on the low. The week would then be a sell signal bar on the weekly chart for a micro wedge. That would increase the chance of lower prices next week.
Yesterday’s setups

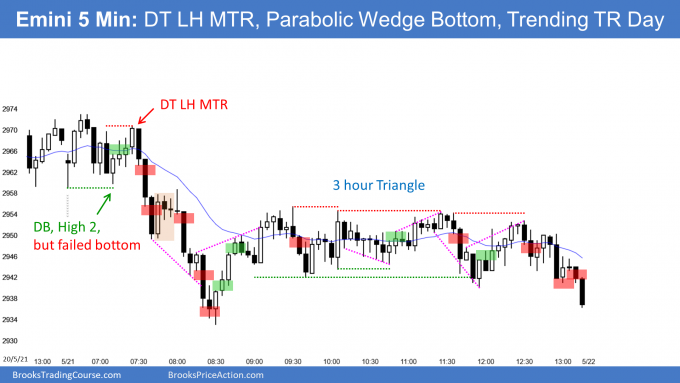
Here are several reasonable stop entry setups from yesterday. I show each buy entry with a green rectangle and each sell entry with a red rectangle. I rarely also show limit order entries and entries on the close of bars. I do not want the lines to be distracting. If they are longer, I make them dotted. But, they have to be visible, so I make the shorter ones solid. Buyers of the Brooks Trading Course and Encyclopedia of Chart Patterns have access to a much more detailed explanation of the swing trades for each day (see Online Course/BTC Daily Setups).
My goal with these charts is to present an Always In perspective. If a trader was trying to be Always In or nearly Always In a position all day, and he was not currently in the market, these entries would be logical times for him to enter.
If the risk is too big for your account, you should wait for trades with less risk or trade an alternative market like the Micro Emini.
EURUSD Forex market trading strategies

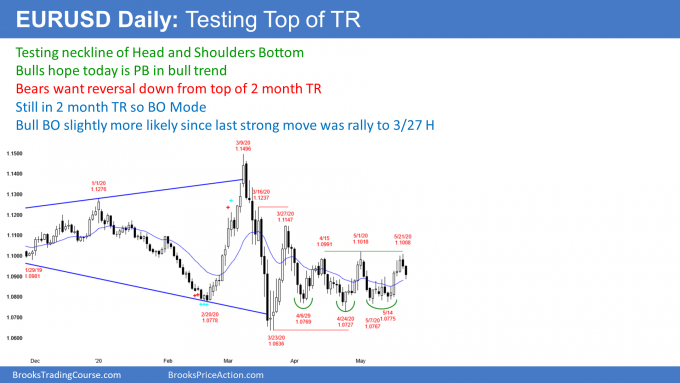
The EURUSD Forex market on the daily chart is testing the top of its 2 month trading range. The May 1 high is also the neckline of a head and shoulders bottom. Traders are deciding if the breakout attempt will succeed or fail. Is today a pullback in an early bull trend or is it the start of a leg down in the trading range?
With just 2 unremarkable bear bars above the EMA, this is more likely a pullback. But legs up and down in trading ranges routinely disappoint traders. The odds are only slightly better than 50 – 50. If today or Monday closes on its low and below the EMA, then traders will conclude that the daily chart is back to neutral. It could even be slightly bearish if either day was a huge bear day.
Weekly support and resistance are important on Fridays
Today is Friday and therefore weekly support and resistance are important. On the weekly chart, there is a micro double bottom. This week triggered the buy signal by going above last week’s high.
However, the 2 day selloff has the EMA back in the middle of the week’s range and exactly at last week’s high. If the bulls can get a close above both of those prices, it would increase the chance of sideways to up trading next week. If they fail, traders will look for sideways to down trading next week.
The most important point is that the daily chart is in a 2 month trading range. Most breakout attempts fail. Traders expect reversals until there is a clear breakout above or below the range.
Overnight EURUSD Forex trading
The 5 minute chart of the EURUSD Forex market sold off overnight until 2 hours ago. But like trends this month, it lacked consecutive big bear bars. There was not much energy.
It reversed up from a wedge bottom 2 hours ago and it now has been in a trading range for 4 hours. Day traders have switched to scalping up and down.
The bulls hope for a higher low and then a bull trend reversal. If they can get today to close above the open, today would be a credible buy signal bar on the daily chart. There would be a High 1 bull flag. That would increase the chance of another attempt to break above the trading range next week.
Can today become a big bear day? Unlikely. The selloff in the Asian and European sessions was not strong. The 2 hour reversal up has been strong enough to make traders expect a trading range or a rally back to the open.
Summary of today’s S&P Emini futures price action and what to expect tomorrow

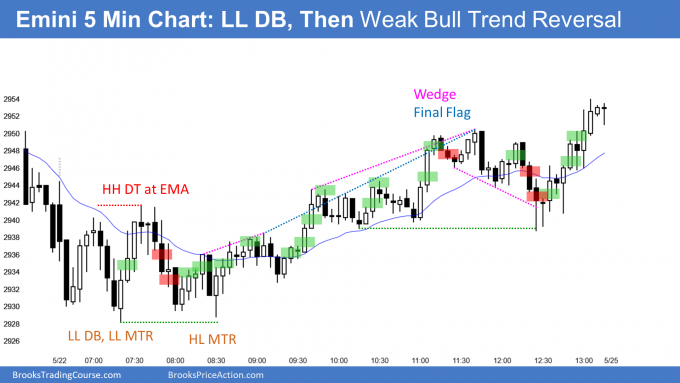
Here are several reasonable stop entry setups for today. I show each buy entry with a green rectangle and each sell entry with a red rectangle. I rarely also show limit order entries and entries on the close of bars. I do not want the lines to be distracting. If they are longer, I make them dotted. But, they have to be visible, so I make the shorter ones solid. Buyers of the Brooks Trading Course and Encyclopedia of Chart Patterns have access to a much more detailed explanation of the swing trades for each day (see Online Course/BTC Daily Setups).
My goal with these charts is to present an Always In perspective. If a trader was trying to be Always In or nearly Always In a position all day, and he was not currently in the market, these entries would be logical times for him to enter.
If the risk is too big for your account, you should wait for trades with less risk or trade an alternative market like the Micro Emini.
End of day summary
Today was a weak bull trend reversal day with a lot of trading range price action. There was a reversal up from a higher low major trend reversal at the open of the week. The market was drawn up to the Globex high at the end of the day. It also was pulled up to the April high, where it spent the entire week.
Today and the week had bull bodies and the 200 day SMA is a magnet above. Traders expect at least slightly higher prices next week.
Today is also a High 1 bull flag buy signal bar on the daily chart. But it had only a small bull body and it followed a big bear bar yesterday. In addition, there is a 5 day tight trading range. This is not a strong buy signal, even though the Emini should go at least a little higher next week.
See the weekly update for a discussion of the price action on the weekly chart and for what to expect going into next week.
Trading Room
Traders can see the end of the day bar-by-bar price action report by signing up for free at BrooksPriceAction.com. I talk about the detailed S&P Emini futures price action real-time throughout the day in the BrooksPriceAction.com trading room. We offer a 2 day free trial.
Charts use Pacific Standard Time
When I mention time, it is USA Pacific Standard Time (the Emini day session opens at 6:30 am PST, and closes at 1:15 pm PST). You can read background information on the intraday market reports on the Market Update page.
Hi
Could you by any chance mark BTC good for measure moves? Could be on Brooks Trading Course Daily Setups. And which do you think are better for beginners BTC for measure move or just normal swings with 1:2 rr. Also is it ok to rely on you stop and target ? Just take the trade and let it hit your stop or target. Without any management during the trade. And Is every stop entry you mark good for scalp 1:1 rr ?
Kind regards
K.Gemra
Hi Kajetan,
Thanks for your comment but sorry to disappoint you and say that this is not the place for such discussions. Comments here ought to be directed to post itself, and not general trading stuff.
As you said, the Daily Setups area is more relevant for your first query, and yes, Al does in fact mark up Measured Moves on daily charts there where applicable. Note that a Measured Move is used for a potential profit target and may not have anything to do with your particular trade with its own parameters. The MM may be far away from your 1:2rr, for example.
For your other queries, you are mixing up several areas of study so best to drop such specific queries in the relevant Q&A or video support forum that is being opened up for input very soon (Monday latest). Then other traders can contribute their answers giving you more feedback to work with. The answers would then be available to all in the forum and not lost as the original post here ages.
Trust you understand what I am trying to say here.
Hi Al, very nice daily summary as usual… I am just wondering that for the pandemic, it seems that the worst is over, people are at least looking for the economical recovery… what would be the catalyst to trigger the stock to go down right now? the second wave? US-China spats? There can not be something more shocking than the shutdown, but now the shutdown appears to be relaxed..
I will write about this over the weekend. The stock market has been sideways for 2 1/2 years. It looks like it will be sideways for the rest of this year.
I wonder the same. All the bad news have been priced in, all the good news as well. One catalyst for a pullback could be profit taking, since traders are uncertain of the outlook nearing the election, they could take some money off the table. Another one is the FED, if they take a more wait&see stance. And we have been in a TR for the last month, with a seemingly stronger bullish setup. How far can the bulls breakout after a month long TR? Thank you, Al, and looking forward to the weekend summary.
As long as there are weak bears shorting and getting squeezed, the rally will continue. But 3,100 is where the serious bears will sell and where the strong bulls will take profits.
There is only a 30% chance of the rally going above the February high. I have been saying that for over a month, and that is still the case.
What is different now is that the rally is reaching the final target without 1st having a pullback. That will make the pullback last longer than what the bulls want.
A minimum goal is 2800, but I think there is better than a 50% chance of it falling below the below the March 31 high and testing 2,600. Then, there will be a higher low and the market will continue sideways for the rest of the year. This is true whether Trump or Biden wins.