Emini and Forex Trading Update:
Tuesday May 19, 2020
I will update again at the end of the day.
Pre-Open market analysis
The Emini triggered a High 1 bull signal on the monthly chart yesterday by going above the April high. This also theoretically stopped out the bears who shorted the wedge top on the daily chart.
It closed back at the April high, where it spend much of yesterday. After a big gap up, the Emini often goes sideways for a day or two before resuming up to the next target.
I have mentioned the 200 day moving average many times. The rally should get there this week. It could get there today. That is also around the 3,000 Big Round Number.
The minimum goal is to reach the 200 day moving average, which is around the 3,000 Big Round Number. The bulls want the rally to continue to the March 3 high. That was the start of the parabolic wedge sell climax on the daily chart. Also, it is at a measured move up from the month-long trading range.
Because the 2 bears bars on the monthly chart were huge, this rally will probably have a 2nd leg sideways to down before there is a new all-time high. That leg down should begin within a few weeks. The sell zone is between 3,000 and 3,100, which is around the March 3 high.
Overnight Emini Globex trading
The Emini is down 4 points in the Globex session. Yesterday’s late selloff was a bear Surprise Breakout. A bear surprise typically has at least a small 2nd leg sideways to down. Also, Big Up, Big Down creates Big Confusion. Since confusion is a hallmark of a trading range, traders expect sideways trading today.
The bears want that selloff to be a spike down in a new bear trend on the daily chart. They then hope that today will be the start of a channel down for the next several days. If they get that, traders will conclude that yesterday’s breakout above the April high failed.
However, what is more likely is that the selloff will simply be the start of a 1 – 3 day sideways to down pullback from triggering the monthly buy signal. There is a 55% chance that this rally will reach the measured move target at the March 3 high before there is more than a 3 – 5 day pullback
Yesterday’s setups

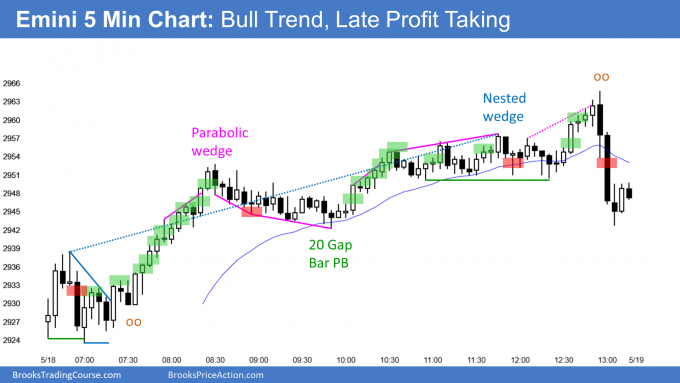
Here are several reasonable stop entry setups from yesterday. I show each buy entry with a green rectangle and each sell entry with a red rectangle. I rarely also show limit order entries and entries on the close of bars. I do not want the lines to be distracting. If they are longer, I make them dotted. But, they have to be visible, so I make the shorter ones solid. Buyers of the Brooks Trading Course and Encyclopedia of Chart Patterns have access to a much more detailed explanation of the swing trades for each day (see Online Course/BTC Daily Setups).
My goal with these charts is to present an Always In perspective. If a trader was trying to be Always In or nearly Always In a position all day, and he was not currently in the market, these entries would be logical times for him to enter.
If the risk is too big for your account, you should wait for trades with less risk or trade an alternative market like the Micro Emini.
EURUSD Forex market trading strategies

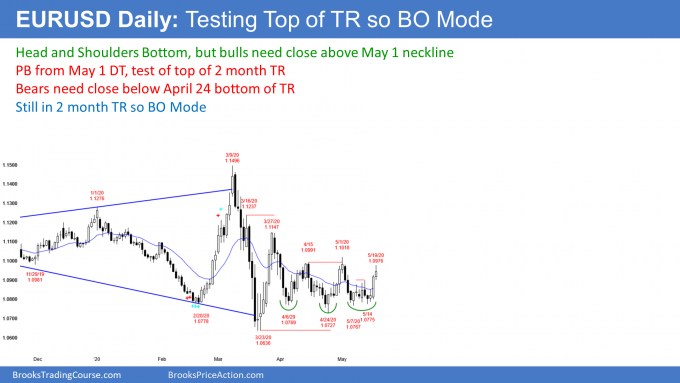
The EURUSD Forex market on the daily chart rallied strongly yesterday and it is now at the top of its 2 month trading range. But while yesterday increases the chance of a bull breakout, until there is a breakout, there is no breakout.
Traders know that the probability is cannot be more than 55% for either the bulls or the bears until there is a clear breakout. They want to see a close far above or below the range. If a breakout has consecutive closes, it is more likely to be successful.
Once there is a breakout up or down, traders will look for a move that is approximately as big as the trading range is tall. Because the range is 300 pips tall, traders would look for a measured move up from a bull breakout to reach around 1.13. That is still far below the March 9 high, which is the top of the 8 month trading range.
Since the daily chart is still in a trading range, the bears always have a reasonable argument. They would like a reversal down from around the top of the range. If it comes from a lower high, they will see the week-long rally as a pullback from the reversal down from the April/May double top. If it comes from above the May high, they would then see the reversal as simply a failed breakout above the trading range.
Overnight EURUSD Forex trading
The 5 minute chart of the EURUSD Forex market had some overnight follow-through buying after yesterday’s bull trend. However, it has sold off 30 pips over the past 2 hours.
Since the selloff has been in a tight bear channel, it is strong. That relentless profit-taking by the bulls reduces the chance of a strong bull trend today.
Can today continue down? The bear bars have been small and yesterday was strongly bullish. That combination makes a much bigger selloff unlikely.
If it will not go up or down much today, traders are left with a trading range. They will look for 10 – 20 pip scalps up and down.
The bulls would like the day to close near its high. That would increase the chance of higher prices tomorrow. It would also increase the chance of a break above the range within a week.
If today closes on the low and there is a bear body on the daily chart, traders will expect at least slightly lower prices tomorrow. But yesterday was surprisingly big. A bull surprise bar on the daily chart typically has at least a small 2nd leg sideways to up. Therefore, the downside over the next few days is not big.
Summary of today’s S&P Emini futures price action and what to expect tomorrow

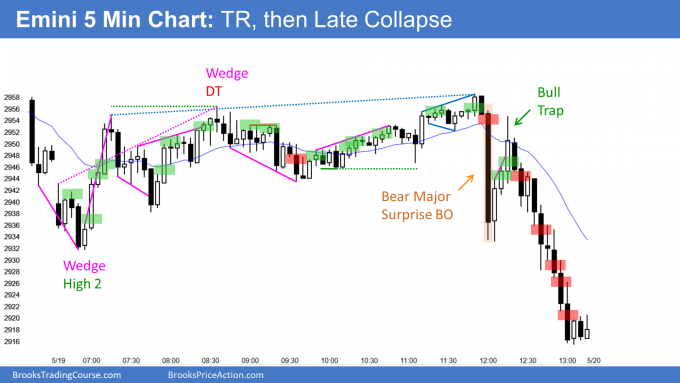
Here are several reasonable stop entry setups for today. I show each buy entry with a green rectangle and each sell entry with a red rectangle. I rarely also show limit order entries and entries on the close of bars. I do not want the lines to be distracting. If they are longer, I make them dotted. But, they have to be visible, so I make the shorter ones solid. Buyers of the Brooks Trading Course and Encyclopedia of Chart Patterns have access to a much more detailed explanation of the swing trades for each day (see Online Course/BTC Daily Setups).
My goal with these charts is to present an Always In perspective. If a trader was trying to be Always In or nearly Always In a position all day, and he was not currently in the market, these entries would be logical times for him to enter.
If the risk is too big for your account, you should wait for trades with less risk or trade an alternative market like the Micro Emini.
End of day summary
On the open, today reversed up from an early test of yesterday’s low. However, the Emini spent much of the rest of the day in a trading range around the April high. It collapsed to below yesterday’s low into the close.
Today is a sell signal bar on the daily chart for a failed breakout above the month-long trading range and the April high. The daily chart is overbought and traders expect about a 3 week pullback in June. The bears hope it began today.
But yesterday’s strong rally and the break above the wedge on the daily chart make it slightly more likely that a reversal down will last only a day or two. This is especially true because the March 3 high and the 200 day moving average are important magnets above. However, there will probably be a pullback for several weeks beginning around the April high or the 200 day moving average.
See the weekly update for a discussion of the price action on the weekly chart and for what to expect going into next week.
Trading Room
Traders can see the end of the day bar-by-bar price action report by signing up for free at BrooksPriceAction.com. I talk about the detailed S&P Emini futures price action real-time throughout the day in the BrooksPriceAction.com trading room. We offer a 2 day free trial.
Charts use Pacific Standard Time
When I mention time, it is USA Pacific Standard Time (the Emini day session opens at 6:30 am PST, and closes at 1:15 pm PST). You can read background information on the intraday market reports on the Market Update page.
Hey Al,
After that huge bear bar late in the day and a decent bull rally back up I was thinking big down big up big confusion so trading range. I was also thinking maybe a bear major surpise bar an spike an channel which we got but it still caught me a little by surpise an therefore I didn’t trade any of it. Can you give any more insight on how to have read the chart for an edge?
Same here, that huge bear bar got me thinking ” I am not jumping in here” so I stayed on the sidelines. Should have jumped back in after the pullback but it was too late in the day and I thought we are gonna end up where we started. Oh well, we had a nice BO in the final minutes. Pretty curious to Al`s comment after today`s session. As expected, after yesterday rally, today was mostly TR action and it could be a PB from the rally, but bulls are having a hard time to hit the MAs above, I wonder when they will give up. Obviously, I am bearish and waiting for 2600ish to load up on longs, I hope it comes before 3k 🙂
I created a slide about that for my Encyclopedia. About half of the time when there is a clear start of a trend, the market does something to trap traders out.
That rally was a bull trap. It trapped many bears out and many bulls in. But as long as it stayed below the top of the Bear Major Surprise, it was more likely a trap than a new bull trend.
It is a good example of how much risk a trader takes sometimes when taking a high probability trade, like selling the close of the bar bar.
If a trader panics and exits, he can wait for 1 or 2 bear bars closing near their lows and take the Forrest Gump entry. Trade stupid and enter with a stop below a bear bar closing in its lower third.
It is difficult when everyone is tired, and it is fine to not take any of the trades. But, that is the best way to enter.