Market Overview: Crude Oil Futures
The market formed a monthly Crude Oil testing the trading range low. The bears need to create a strong breakout below the December and May lows with follow-through selling to increase the odds of a measured move down. The bulls hope the trading range low area will act as support.
Crude oil futures
The Monthly crude oil chart
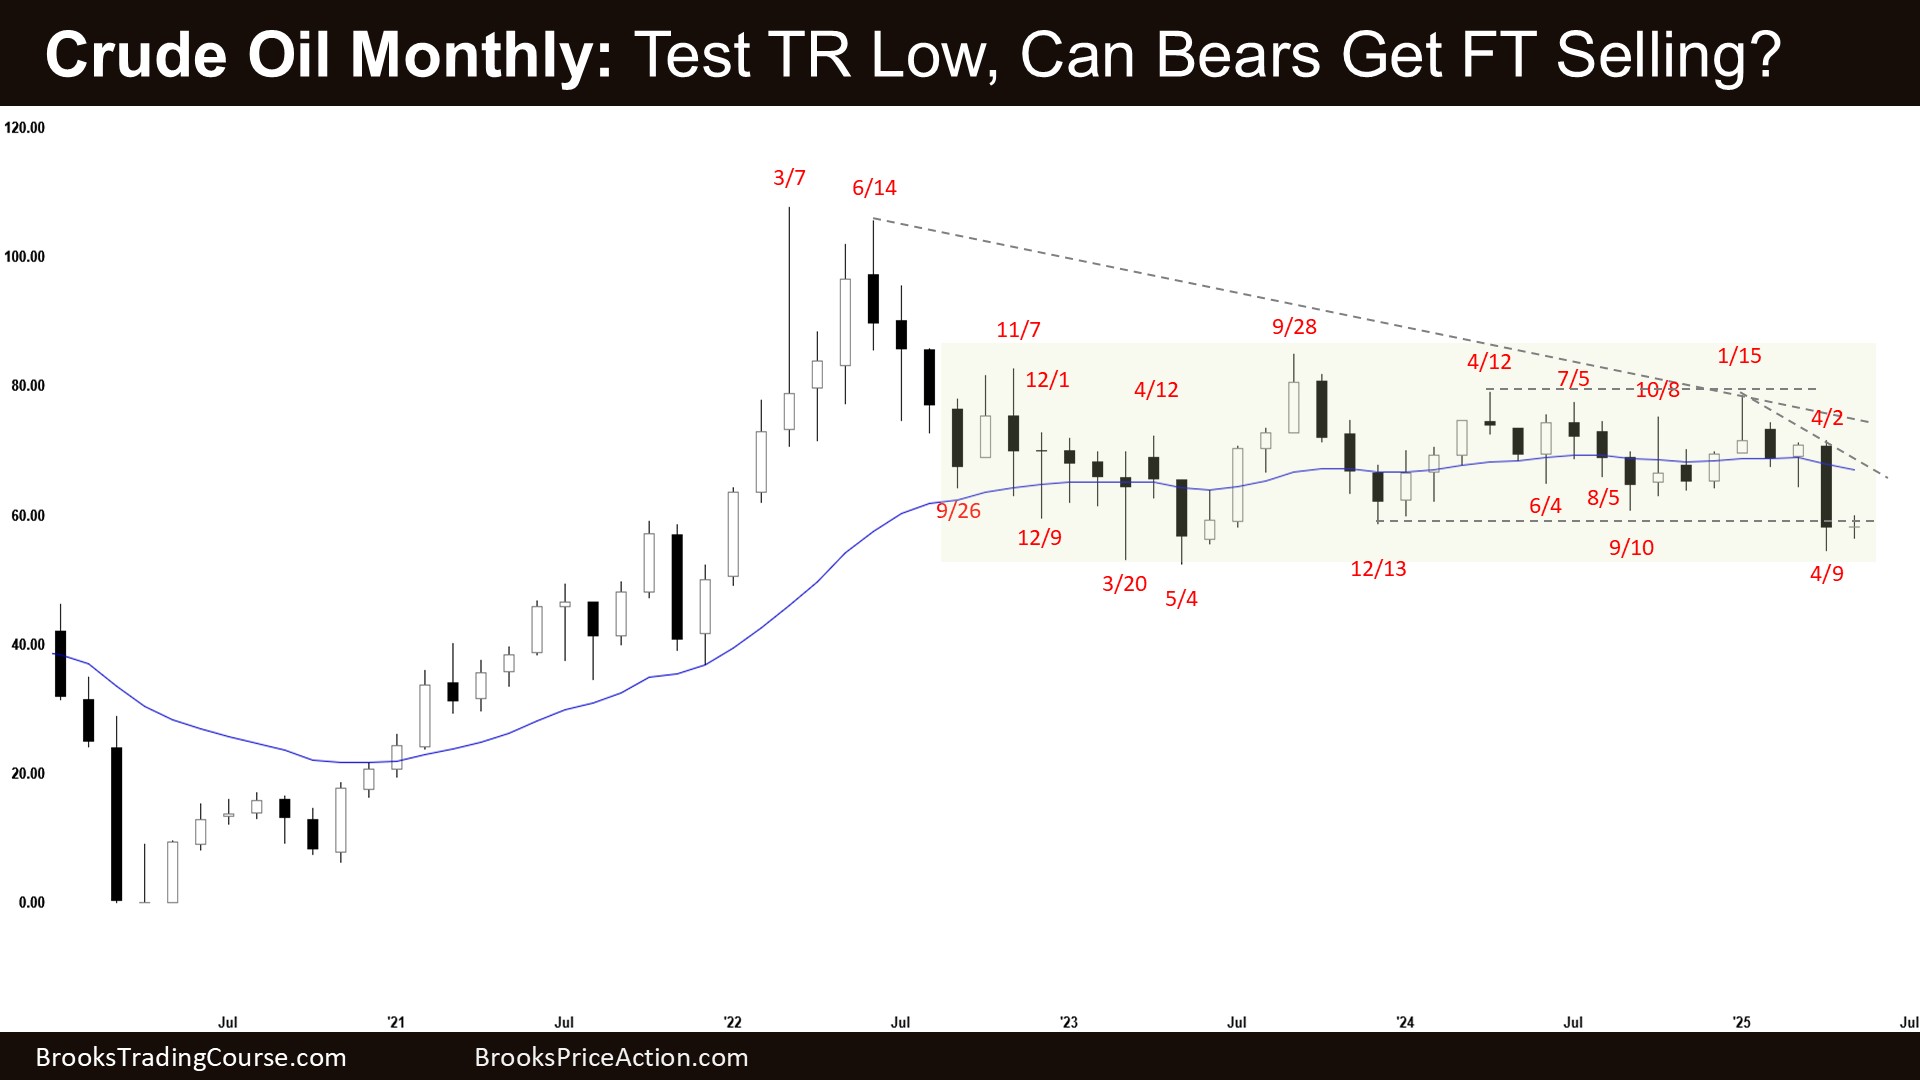
- The April monthly Crude Oil candlestick was a big bear bar closing in its lower half with a prominent tail below.
- Last month, we said traders would see if the bears could create a strong breakout below the September or December low with follow-through selling, or if the market would stall around the trading range low and close the monthly candlestick with a long tail instead.
- The bears got a strong bear leg to retest the bottom of the trading range.
- They want a breakout below the trading range followed by a measured move based on the height of the trading range.
- They need to create a strong breakout below the December and May lows with follow-through selling to increase the odds of a measured move down.
- The bulls see the current move as a bear leg and a sell vacuum testing the trading range low.
- They hope the December low area will act as support.
- If the market trades lower, they want the May low to act as support.
- They want the market to retest the middle of the trading range (around the 20-month EMA).
- As strong as the recent selloff is, it could still be a sell vacuum and a bear leg within the trading range.
- The market is currently trading around the lower third of the trading range which can be the buy zone of trading range traders.
- Traders will BLSH (Buy Low, Sell High) in a trading range until a breakout with sustained follow-through buying/selling.
- That means buying in the lower third or selling in the upper third of the trading range.
- For now, traders will see if the bears can create a follow-through bear bar in May.
- Or will the market stall around the current levels and trade higher instead?
- Markets have inertia and tend to continue what they have been doing.
- Until a breakout with strong follow-through selling, the market remains in a trading range.
- Poor follow-through and frequent reversals are hallmarks of trading ranges.
The Weekly crude oil chart

- This week’s candlestick on the weekly Crude Oil chart was a bear bar closing in its lower half with a prominent tail below.
- Last week, we said traders would see if the bulls could create more follow-through bull bars, or if the market would stall and form a retest of the April 9 low instead.
- The market formed another leg down to retest the April 9 low, a higher low so far.
- The bulls see the recent move (April 9) as a large 2-legged sell vacuum and a bear leg within the trading range.
- They see the move this week as a retest of the prior low.
- They want a reversal from a higher low major trend reversal.
- They hope to get a retest of the middle of the trading range.
- If the market trades lower, they want it to form a double bottom (with Apr 9 low).
- The bears got a large 2-legged bear leg testing the bottom of the trading range.
- They hope to get a retest of the April 9 low, even if it only forms a higher low. The move is currently underway.
- They want the third leg down completing the wedge pattern with the first two legs being the March 5 and April 9 lows.
- They need to create more bear bars to increase the odds of a breakout below the trading range.
- While the recent move down was strong (Apr 9), it could still only be a sell vacuum and a bear leg testing the bottom of the trading range.
- Crude oil is currently trading around the lower third of the trading range which can be the buy zone of trading range traders.
- The market remains in a large trading range.
- Traders will BLSH (Buy Low, Sell High) until there is a breakout from either direction with sustained follow-through buying/selling.
- That means selling in the upper third and buying in the lower third of the trading range.
- For now, traders will see if the bears can create a follow-through bear bar. That would increase the odds of a retest and breakout below the April 9 low.
- Or will the market stall around the trading range low and trade higher instead?
- Poor follow-through and frequent reversals are hallmarks of trading ranges.
Market analysis reports archive
You can access all weekend reports on the Market Analysis page.


That 55 has to crack! 60 Resi right now…
Ola Paul,
Thanks for going through the report..
Have a great weekend ahead!
Best Regards,
Andrew