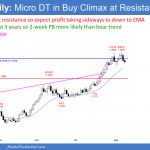
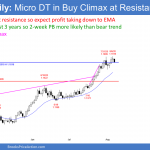
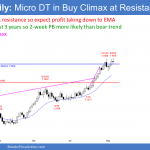
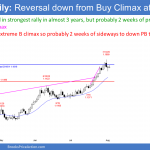
Emini and Forex Trading Update:Monday August 10, 2020 I will update again at the end of the day. Pre-Open market analysis The Emini closed on its high on Friday. Three of the past 5 weeks gapped up on Monday. The bulls want another gap on the weekly chart again today. There is a small chance […]
Market Update Report for the S&P500 Emini (ES) will be available to logged-in Brooks Trading Course members within 1-2 hours after US market open each day. The update will be available to everyone, including visitors, about 2 hours or more after market open.
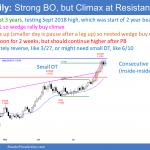
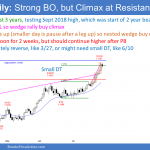
Emini formed big outside up day just below all time high
Emini and Forex Trading Update:Friday August 7, 2020 I will update again at the end of the day. Pre-Open market analysis Yesterday traded above Wednesday’s high and below its low and therefore was an outside day. It then traded back above yesterday’s high and became an outside up day. It was a big outside up […]
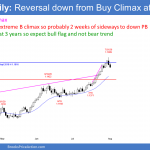
Emini closed the February pandemic gap down
Emini and Forex Trading Update:Thursday August 6, 2020 I will update again at the end of the day. Pre-Open market analysis The Emini yesterday closed the February gap at the start of the pandemic crash. The bulls are looking for a reason to take some profits. Closing the gap might do it. But the 5 […]
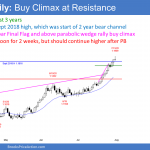
Emini weak follow through buying after weekly and monthly gap up
Emini and Forex Trading Update:Wednesday August 5, 2020 I will update again at the end of the day. Pre-Open market analysis The Emini gapped up on the daily, weekly, and monthly charts on Monday. Traders expect at least slightly higher prices. With yesterday closing on its high and with the top of the February gap […]
Emini with rare gap up on monthly chart
Emini and Forex Trading Update:Tuesday August 4, 2020 I will update again at the end of the day. Pre-Open market analysis The Emini gapped up yesterday. There was also a gap up on the weekly and monthly charts as well. Gaps on the monthly chart are rare. Since there was a gap down in February […]
Emini making 3rd attempt at island bottom on weekly chart
Emini and Forex Trading Update:Monday August 3, 2020 I will update again at the end of the day. Pre-Open market analysis I wrote on Friday and over the weekend that the Emini gapped up on the weekly chart 2 and 3 weeks ago. Both gaps quickly closed, but there briefly was a 4 month island […]
Emini in July might close today above June high
Emini and Forex Trading Update:Friday July 31, 2020 I will update again at the end of the day. Pre-Open market analysis The Emini sold off yesterday, but reversed up strongly from just above last week’s low and into the February gap. Because it was a bull bar and the Emini is in a bull trend […]
Emini rallied after FOMC report to just below July high
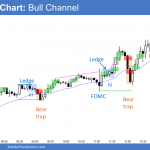
Emini and Forex Trading Update:Thursday July 30, 2020 I will update again at the end of the day. Pre-Open market analysis The Emini yesterday rallied back into the gap on the weekly chart above the February 24 high. I have been saying it probably would do that. The bulls want a new all-time high, which […]
Emini testing February gap ahead of July FOMC announcement
Emini and Forex Trading Update:Wednesday July 29, 2020 I will update again at the end of the day. Pre-Open market analysis Today is an FOMC day. There is a sharp move up and down 70% of the time in the 1st few minutes after the 11 am PST announcement. Day traders should exit positions ahead […]
Emini weak High 1 bull flag buy signal at end of July
Emini and Forex Trading Update:Tuesday July 28, 2020 I will update again at the end of the day. Pre-Open market analysis Friday was a High 1 bull flag buy signal bar on the daily chart. The buy triggered yesterday when yesterday traded above Friday’s high. The bulls want the Small Pullback Bull Trend on the […]

