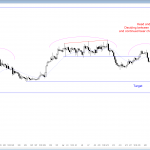
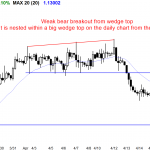
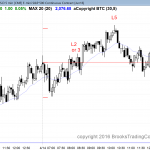
Posted 7:01 a.m. The Emini reversed up sharply after a dip below the bottom of the FOMC bull reversal, and became Always In Long. The bears tried for an Opening Reversal down from the moving average and a 50% pullback, but the rally was strong enough to make this a low probability bet. It is […]
Market Update Report for the S&P500 Emini (ES) will be available to logged-in Brooks Trading Course members within 1-2 hours after US market open each day. The update will be available to everyone, including visitors, about 2 hours or more after market open.
Intraday market update: April 28, 2016
Intraday market update: April 27, 2016
Candlestick patterns and price action after an FOMC report
Posted 7:01 a.m. The Emini reversed up from a test of yesterday’s low, but lacked follow-through. Yesterday was a tight trading range. The Emini has not yet done enough to convince traders that it is about to have a swing up or down. It might reach a measured move up or down, based on the […]
Intraday market update: April 26, 2016
Learn how to trade TR price action before FOMC
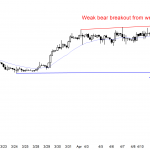
Posted 7:10 a.m. The Emini gapped above yesterday’s high triggering a High 1 bull flag buy signal on the daily chart. Limit order bears could not make any money in the 1st 30 minutes. Even though the Emini has had a series of buy climaxes since the last hour of yesterday and it testing the […]
Intraday market update: April 25, 2016
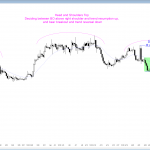
Day traders see a weak bull flag candlestick pattern
Posted 7:09 a.m. The Emini tested yesterday’s low, but stalled in yesterday’s lower trading range. While the Emini is Always In Short, the initial sell signal bar at the high of the day had a bull body and it was not quite at the moving average. This happens more often in a trading range than […]
Intraday market update: April 22, 2016
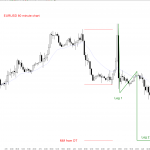
Learn how to trade a pullback candlestick pattern
Posted 7:00 a.m. The Emini reversed up from below yesterday’s low in the first minute of the day. Although it had several consecutive bull bars, they had prominent tails. This happens more in a bull leg in a trading range than in a bull trend. Unless the bulls get a strong bull breakout above the […]
Intraday market update: April 21, 2016
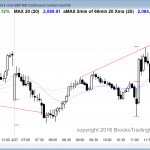
Price action favors trading range candlestick pattern today
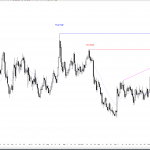
Posted 7:12 a.m. The Emini sold off on the open to the 60 minute moving average. Yesterday was a sell signal bar on the daily chart, and today’s selloff is near the support of yesterday’s low. The selloff has been strong enough for today to trigger the short below yesterday’s low. However, the selloff is […]
Intraday market update: April 20, 2016
Online day traders expect breakout price action
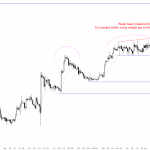
Posted 6:46 a.m. The quiet, tight bull channel from yesterday continued on the open today. The bulls want the reversal up from the moving average to be an Opening Reversal that leads to a new all-time high. The bears want the weak rally fro 41 yesterday to be a leg in a trading range. Until […]
Intraday market update: April 15, 2016
Learn how to trade doji candlestick patterns
Posted 6:56 a.m. Yesterday is a sell signal bar on the daily chart, but it is a doji after 2 good bull bars. The odds are that there will be buyers below yesterday’s low. The bears want a bear trend, but the bulls scalpers have already made money twice today and the bear bars are […]
Intraday market update: April 14, 2016
Learn how to trade price action at resistance
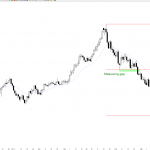
Posted 7:06 a.m. The Emini reversed down from above yesterday’s high, but it lacked consecutive big bear trend bars. The odds are that yesterday’s bull channel was a bull leg in what will become a trading range. The Emini is Always In Short, and it probably will test higher lows in yesterday’s channel. It might […]
Intraday market update: April 13, 2016
Learn how to trade a possible new all time high
Posted 7:05 a.m. The Emini gapped up and had 3 early bull bars, but the bars overlapped and had tails. This was a weak opening for the bulls. Also, limit order bears made money twice in the 1st 5 bars. This is not how bull trends typically begin and it increases the chances of a […]

