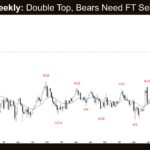
Market Overview: Crude Oil Futures Crude oil bears need follow-through bear bars on the weekly chart to increase the odds of a deeper pullback. Bulls see the current move as a pullback and hope it will lack follow-through selling, followed by another retest of the March 9 high. Crude oil futures The Weekly crude oil […]
If you are not seeing the latest Weekly Report below, your PC/device browser is likely showing you an earlier page copy. Simply refresh your browser. For PCs you can use the F5 key, or Ctrl-F5, several times if needed.
EURUSD Bulls Need Follow-through Bull Bars
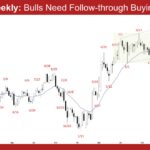
Market Overview: EURUSD Forex The EURUSD bulls need follow-through bull bars on the weekly chart to increase the odds of a retest of the range high. Bears want the market to reverse below the 20-week EMA. EURUSD Forex market The Weekly EURUSD chart The Daily EURUSD chart Market analysis reports archive You can access all […]
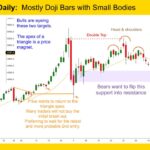
Bitcoin Daily at Upper Third of Trading Range

Market Video Report: Bitcoin Duration 11:28 mins. Summary Bitcoin is facing a major bear trend or a major trading range. Within the report, we analyze the “Market Inertia” following a long-term bull trend and identify the key “Rule of Thirds” levels, targeting an equilibrium zone between $80,000 and $100,000, along with a specific trade setup […]
Gold 50% Pull Backs in Both Directions
Gold GC-Mini Market Analysis The weekly Gold GC-mini chart is in a trading range following a climax. While the trend is up, the price action is becoming increasingly two-sided. This week there was bullish follow through. Printing 3 consecutive bull bars puts the market into always in long. Take note of the bull bars gradually […]
Nasdaq 100 First Close Above Ema Since Early February
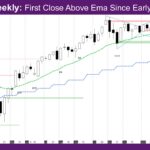
Market Overview: NASDAQ 100 E-mini Futures The NASDAQ E-mini futures week is a bull trend bar and a good entry to last week’s buy signal bar. It is the first close above EMA since early February. The EMA is the 20-period exponential moving average. The daily chart is exceptionally strong – all days were bull […]
Nifty 50 Sharp Reversal with Strong Bar
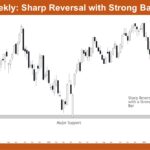
Market Overview: Nifty 50 Futures Nifty 50 Sharp Reversal with Strong Bar on the weekly chart. The market reversed sharply from major support with a very large bull bar closing near its high, which suggests strong buying pressure and that the recent selloff may have exhausted itself. This reversal bar indicates the market is likely […]
E-mini Follow-through for Bulls

Trading Update: Friday April 10, 2026 E-mini end of day video review S&P E-mini market analysis E-mini daily chart E-mini 5-minute chart and what to expect today Yesterday’s E-mini setups Richard created the SP500 E-mini chart. Here are reasonable stop entry setups from yesterday. Chart shows each buy entry bar with a green arrow and […]
E-mini Bulls Want Test of All-Time High
Trading Update: Thursday April 9, 2026 E-mini end of day video review S&P E-mini market analysis E-mini daily chart E-mini 5-minute chart and what to expect today Yesterday’s E-mini setups Richard created the SP500 E-mini chart. Here are reasonable stop entry setups from yesterday. Chart shows each buy entry bar with a green arrow and […]
E-mini Bulls Getting Breakout Above Daily Moving Average
Trading Update: Wednesday April 8, 2026 E-mini end of day video review S&P E-mini market analysis E-mini daily chart E-mini 5-minute chart and what to expect today Yesterday’s E-mini setups Richard created the SP500 E-mini chart. Here are reasonable stop entry setups from yesterday. Chart shows each buy entry bar with a green arrow and […]
E-mini 6,650 Round Number Acting as Resistance
Trading Update: Tuesday April 7, 2026 S&P E-mini market analysis E-mini daily chart E-mini 5-minute chart and what to expect today Yesterday’s E-mini setups Richard created the SP500 E-mini chart. Here are reasonable stop entry setups from yesterday. Chart shows each buy entry bar with a green arrow and each sell entry bar with a […]

