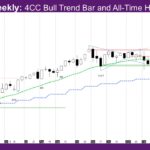
Market Overview: NASDAQ 100 E-mini Futures The NASDAQ E-mini futures week is a 4CC bull trend bar and all-time high close – 4CC meaning 4th consecutive. The daily chart started the channel phase this week after the spike last week – inside day, alternate bull/bear days, as well as a pullback day. The monthly bar […]
If you are not seeing the latest Weekly Report below, your PC/device browser is likely showing you an earlier page copy. Simply refresh your browser. For PCs you can use the F5 key, or Ctrl-F5, several times if needed.
Nifty 50 Trading Range Price Action
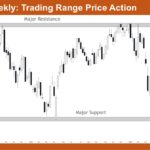
Market Overview: Nifty 50 Futures Nifty 50 Trading Range Price Action on the weekly chart. The market has been oscillating between major support around 21,600 and major resistance near 26,200 for several months, with neither bulls nor bears able to establish decisive control. The recent price action shows the market pulling back from the resistance […]
E-mini Testing 7,200 Round Number
Trading Update: Friday April 24, 2026 E-mini end of day video review S&P E-mini market analysis E-mini daily chart E-mini 5-minute chart and what to expect today Yesterday’s E-mini setups Richard created the SP500 E-mini chart. Here are reasonable stop entry setups from yesterday. Chart shows each buy entry bar with a green arrow and […]
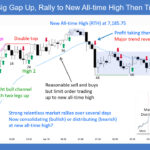
E-mini Sideways For Next Several Weeks
Trading Update: Thursday April 23, 2026 E-mini end of day video review S&P E-mini market analysis E-mini daily chart E-mini 5-minute chart and what to expect today Yesterday’s E-mini setups Richard created the SP500 E-mini chart. Here are reasonable stop entry setups from yesterday. Chart shows each buy entry bar with a green arrow and […]
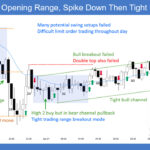
E-mini Sellers Above Yesterday’s High
Trading Update: Wednesday April 22, 2026 E-mini end of day video review S&P E-mini market analysis E-mini daily chart E-mini 5-minute chart and what to expect today Yesterday’s E-mini setups Richard created the SP500 E-mini chart. Here are reasonable stop entry setups from yesterday. Chart shows each buy entry bar with a green arrow and […]
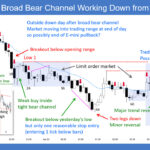
E-mini Exhausted Bulls Pullback Likely to 7,000
Trading Update: Tuesday April 21, 2026 E-mini end of day video review S&P E-mini market analysis E-mini daily chart E-mini 5-minute chart and what to expect today Yesterday’s E-mini setups Richard created the SP500 E-mini chart. Here are reasonable stop entry setups from yesterday. Chart shows each buy entry bar with a green arrow and […]
E-mini Bulls Likely to Take Partial Profits
Trading Update: Monday April 20, 2026 E-mini end of day video review S&P E-mini market analysis E-mini daily chart E-mini 5-minute chart and what to expect today Friday’s E-mini setups Richard created the SP500 E-mini chart. Here are reasonable stop entry setups from Friday. Chart shows each buy entry bar with a green arrow and […]
Strong Weekly E-mini Reversal
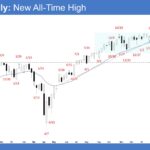
Market Overview: S&P 500 E-mini Futures The market formed a strong weekly E-mini reversal breaking into new all-time high territory. Bulls want a spike and channel pattern lasting many weeks. Bears hope the breakout above the prior all-time high (January 28) will lack follow-through and form a failed breakout. S&P500 E-mini futures The Weekly S&P […]
Large Weekly Crude Oil Trading Range
Market Overview: Crude Oil Futures The market formed a large weekly Crude oil trading range, currently testing near the 20-week EMA. Bulls hope for buyers near the low of the one-bar trading range (March 10). Bears need to create strong bear bars trading below the 20-week EMA to increase the odds of a successful reversal. […]
Weekly EURUSD Bulls Want a Bull Breakout
Market Overview: EURUSD Forex The weekly EURUSD bulls want a bull breakout above the trading range and a measured move up move based on its height. Bears want the move to stall near the top of the trading range, forming a lower high major trend reversal. EURUSD Forex market The Weekly EURUSD chart The Daily […]

