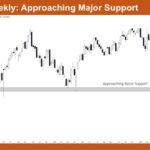
Market Overview: Nifty 50 Futures Nifty 50 Approaching Major Support on the weekly chart. The market has pulled back significantly from the all-time highs around 26,400 and is now testing a major support zone near 21,800 to 22,000, which has acted as support multiple times during the bull trend that began in late 2023. This […]
If you are not seeing the latest Weekly Report below, your PC/device browser is likely showing you an earlier page copy. Simply refresh your browser. For PCs you can use the F5 key, or Ctrl-F5, several times if needed.
E-mini Buyers at the 6,500 Round Number
Trading Update: Friday March 27, 2026 E-mini end of day video review S&P E-mini market analysis E-mini daily chart E-mini 5-minute chart and what to expect today Yesterday’s E-mini setups Richard created the SP500 E-mini chart. Here are reasonable stop entry setups from yesterday. Chart shows each buy entry bar with a green arrow and […]
E-mini Bears Trying to Hold below November 2025 Low
Trading Update: Thursday March 26, 2026 E-mini end of day video review S&P E-mini market analysis E-mini daily chart E-mini 5-minute chart and what to expect today Yesterday’s E-mini setups Richard created the SP500 E-mini chart. Here are reasonable stop entry setups from yesterday. Chart shows each buy entry bar with a green arrow and […]
E-mini Bulls Want Breakout above Weak 1 Low Short
Trading Update: Wednesday March 25, 2026 E-mini end of day video review S&P E-mini market analysis E-mini daily chart E-mini 5-minute chart and what to expect today Yesterday’s E-mini setups Richard created the SP500 E-mini chart. Here are reasonable stop entry setups from yesterday. Chart shows each buy entry bar with a green arrow and […]
E-mini Buyers Below Yesterday’s Weak Low 1 Short
Trading Update: Tuesday March 24, 2026 S&P E-mini market analysis E-mini daily chart E-mini 5-minute chart and what to expect today Yesterday’s E-mini setups Richard created the SP500 E-mini chart. Here are reasonable stop entry setups from yesterday. Chart shows each buy entry bar with a green arrow and each sell entry bar with a […]
E-mini Buyers below November 2025 Low
Trading Update: Monday March 23, 2026 E-mini end of day video review S&P E-mini market analysis E-mini daily chart E-mini 5-minute chart and what to expect today Yesterday’s E-mini setups Richard created the SP500 E-mini chart. Here are reasonable stop entry setups from Friday. Chart shows each buy entry bar with a green arrow and […]
E-mini Formed a Breakout Below the November Low
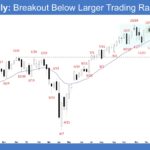
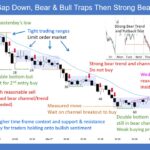
Market Overview: S&P 500 E-mini Futures The S&P 500 E-mini formed a breakout below the November low. Bears need to generate sustained follow-through selling to confirm the breakout. Bulls see the move as a deep pullback testing the December 6, 2024 breakout point and want this area to act as support. S&P500 E-mini futures The […]
1-Bar Crude Oil Trading Range
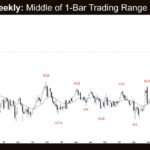
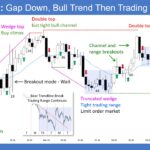
Market Overview: Crude Oil Futures The market is trading sideways around the middle of the 1-Bar Crude oil trading range. Bulls hope for at least a small sideways to up leg retesting the March 9 high, even if it forms a lower high. Bears need strong bear bars closing near their lows to show control. […]
No Breakout Below the EURUSD August low
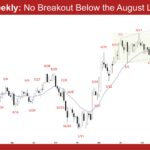
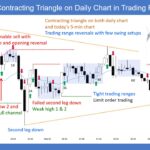
Market Overview: EURUSD Forex There was no breakout below the EURUSD August low this week. Bulls see the market forming a two-bar reversal and a large double bottom bull flag (August 1 and March 13). Bears see this week as a pullback and want a retest of the March 13 low, followed by a strong […]
Bitcoin Low 2 but Bad Location for the Bears

Market Video Report: Bitcoin Duration 12:41 mins. Summary & Transcript This report posits that Bitcoin is transitioning from a bear channel into a long-term trading range. After a second leg down, a recovery toward the equilibrium zone (around $90,000) is probable this year. Hi everyone, and welcome back to this week’s Bitcoin price action analysis. […]

