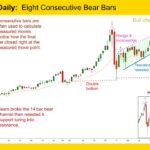
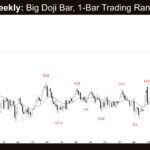
Gold GC-Mini Market Analysis This week the Gold GC-mini ranged to the lows of the initial parabolic correction. Daily bears achieved a rare 8 day losing streak, creating an “always in short” environment. Take note that bulls were able to put significant tails on all of those 8 bear bars. Weekly bears closed with confidence […]
If you are not seeing the latest Weekly Report below, your PC/device browser is likely showing you an earlier page copy. Simply refresh your browser. For PCs you can use the F5 key, or Ctrl-F5, several times if needed.
Nasdaq 100 Bull Body Gap from August 2025 Closed
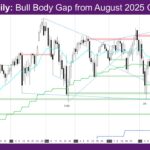
Market Overview: NASDAQ 100 E-mini Futures The NASDAQ E-mini futures week is another bear bar with prominent tails, with the bull body gap from August 2025 closed on the daily chart and the weekly in a leg in trading range to monthly exponential moving average (EMA). The daily chart continued a leg up to the […]
Nifty 50 Broad Bull Channel
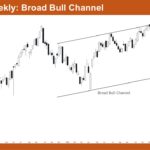
Market Overview: Nifty 50 Futures Nifty 50 Broad Bull Channel on the weekly chart. The market has been trading within a multi-year bull channel, with price consistently respecting the lower channel line as support during pullbacks. Recent weeks show increased volatility near the upper channel line with several large bear bars, suggesting profit-taking and two-sided […]
E-mini Reversal Up Likely Over Next Several Weeks
Trading Update: Friday March 20, 2026 S&P E-mini market analysis E-mini daily chart E-mini 5-minute chart and what to expect today Yesterday’s E-mini setups Richard created the SP500 E-mini chart. Here are reasonable stop entry setups from yesterday. Chart shows each buy entry bar with a green arrow and each sell entry bar with a […]
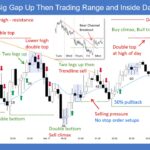
E-mini Testing November 2025 Low
Trading Update: Thursday March 19, 2026 E-mini end of day video review S&P E-mini market analysis E-mini daily chart E-mini 5-minute chart and what to expect today Yesterday’s E-mini setups Richard created the SP500 E-mini chart. Here are reasonable stop entry setups from yesterday. Chart shows each buy entry bar with a green arrow and […]
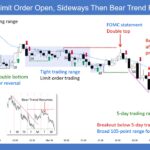
E-mini Bulls Hopeful for Upside Breakout after FOMC
Trading Update: Wednesday March 18, 2026 E-mini end of day video review S&P E-mini market analysis E-mini daily chart E-mini 5-minute chart and what to expect today Yesterday’s E-mini setups Richard created the SP500 E-mini chart. Here are reasonable stop entry setups from yesterday. Chart shows each buy entry bar with a green arrow and […]
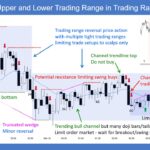
E-mini Bulls Want Test of March 9th High
Trading Update: Tuesday March 17, 2026 E-mini end of day video review S&P E-mini market analysis E-mini daily chart E-mini 5-minute chart and what to expect today Yesterday’s E-mini setups Richard created the SP500 E-mini chart. Here are reasonable stop entry setups from yesterday. Chart shows each buy entry bar with a green arrow and […]
E-mini November 2025 Low Likely Support
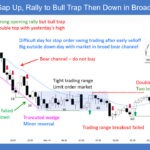
Trading Update: Monday March 16, 2026 E-mini end of day video review S&P E-mini market analysis E-mini daily chart E-mini 5-minute chart and what to expect today Yesterday’s E-mini setups Richard created the SP500 E-mini chart. Here are reasonable stop entry setups from yesterday. Chart shows each buy entry bar with a green arrow and […]
E-mini Bear Leg Testing the November Low
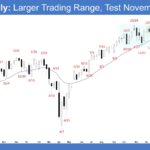
Market Overview: S&P 500 E-mini Futures The market is forming a S&P 500 E-mini bear leg testing the November low. Bears want a strong breakout below the tight trading range and the November low, followed by a measured move toward 6,500 based on the height of the 13-week trading range. If the market breaks below […]
Big Crude Oil Doji Bar
Market Overview: Crude Oil Futures The weekly chart formed a big Crude oil doji bar. It represents a big one-bar trading range where both bulls and bears were active. Bulls hope to get at least a small sideways to up leg to retest the leg’s extreme high (March 9), even if it only forms a […]

