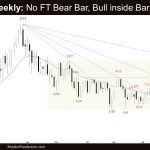
Market Overview: Crude Oil Futures The weekly candlestick was an inside bull bar closing near its high; there was no Crude Oil follow-through selling. The bulls need to create follow-through buying next week to increase the odds of another leg up. The bears want a breakout below the inside bull bar. Crude oil futures The […]
If you are not seeing the latest Weekly Report below, your PC/device browser is likely showing you an earlier page copy. Simply refresh your browser. For PCs you can use the F5 key, or Ctrl-F5, several times if needed.
FTSE 100 Breakout Mode, 2nd Leg Up Likely
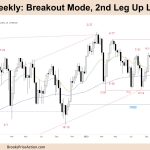
Market Overview: FTSE 100 Futures The FTSE futures market has had shrinking volatility into breakout mode into a triangle near the MAs. While we will probably get a move up and a move down, until the bears break strongly below that bull trend line, the scale in bulls will continue to strongly buy lows and scalp. […]
DAX 40 Sideways at Bear Swing Target, Gap Closed
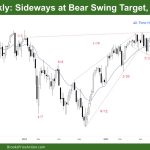
Market Overview: DAX 40 Futures DAX futures moved sideways last week, low in a trading range at the prior swing low. The bears closed the last gaps and have struggled to get a break below this possible wedge bottom channel line. Bulls want to buy, but it is still a low-probability trade until a good […]
Nasdaq 100 Bad Follow-through to Entry Bar of 10/2
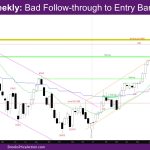
Market Overview: NASDAQ 100 Emini Futures The NASDAQ Emini futures week is a doji bar with a small bull body and a big tail on top. It is a bad follow-through to entry bar of 10/2, closing below last week’s high. On the daily chart, this went up to the high of 9/20 and reversed […]
Nifty 50 Bull Channel
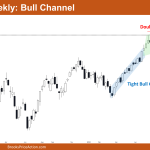
Market Overview: Nifty 50 Futures Nifty 50 Bull Channel on the weekly chart. The market is currently trading close to the bottom of the bull channel after forming a bull bar with a short tail at the top. After the double top reversal attempt, the bears were unable to change the trend. A bear reversal […]
Emini Second Leg Up Likely after Complex Bottom
Trading Update: Friday October 13, 2023 S&P Emini pre-open market analysis Emini daily chart Emini 5-minute chart and what to expect today Emini intraday market update Yesterday’s Emini setups Al created the SP500 Emini charts. Here are reasonable stop entry setups from yesterday. I show each buy entry with a green rectangle and each sell […]
Emini Pullback Likely
Trading Update: Thursday October 12, 2023 S&P Emini pre-open market analysis Emini daily chart Emini 5-minute chart and what to expect today Emini intraday market update Yesterday’s Emini setups Al created the SP500 Emini charts. Here are several reasonable stop entry setups from yesterday. I show each buy entry with a green rectangle and each […]
Emini 4,400 Big Round Number
Trading Update: Wednesday October 11, 2023 S&P Emini pre-open market analysis Emini daily chart Emini 5-minute chart and what to expect today Emini intraday market update Yesterday’s Emini setups Al created the SP500 Emini charts. Here are several reasonable stop entry setups from yesterday. I show each buy entry with a green rectangle and each […]
Emini Testing August 18th Low
Trading Update: Tuesday October 10, 2023 S&P Emini pre-open market analysis Emini daily chart Emini 5-minute chart and what to expect today Yesterday’s Emini setups Al created the SP500 Emini charts. Here are several reasonable stop entry setups from yesterday. I show each buy entry with a green rectangle and each sell entry with a […]
No report today — Brad travelling
Monday October 9, 2023 Brad will be back tomorrow… Friday’s Emini setups Al created the SP500 Emini charts. Here are several reasonable stop entry setups from Friday. I show each buy entry with a green rectangle and each sell entry with a red rectangle. Buyers of both the Brooks Trading Course and Encyclopedia of Chart […]

